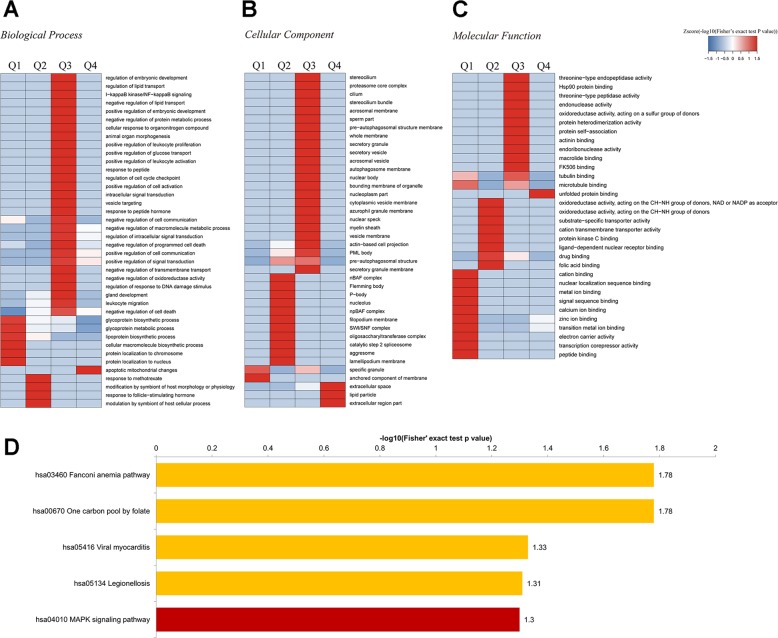
Fig. 5. Proteomic profile after inhibition of IMPA2 in SiHa cells.
a–c Functional enrichment of the differentially expressed proteins (DEPs) between shCtrl and shIMPA2 based on Gene ontology (GO) annotations. The results cover biologic processes (a), cellular component (b), and molecular function (c). d Enrichment of DEPs based on the KEGG pathway database. DEPs were divided into four parts according to the fold ratio of IMPA2 expression level between shCtrl and shIMPA2. Q1, 0 < ratio ≤ 1/2; Q2, 1/2 < ratio ≤ 1/1.5; Q3, 1.5 < ratio ≤ 2; Q4, ratio > 2.

