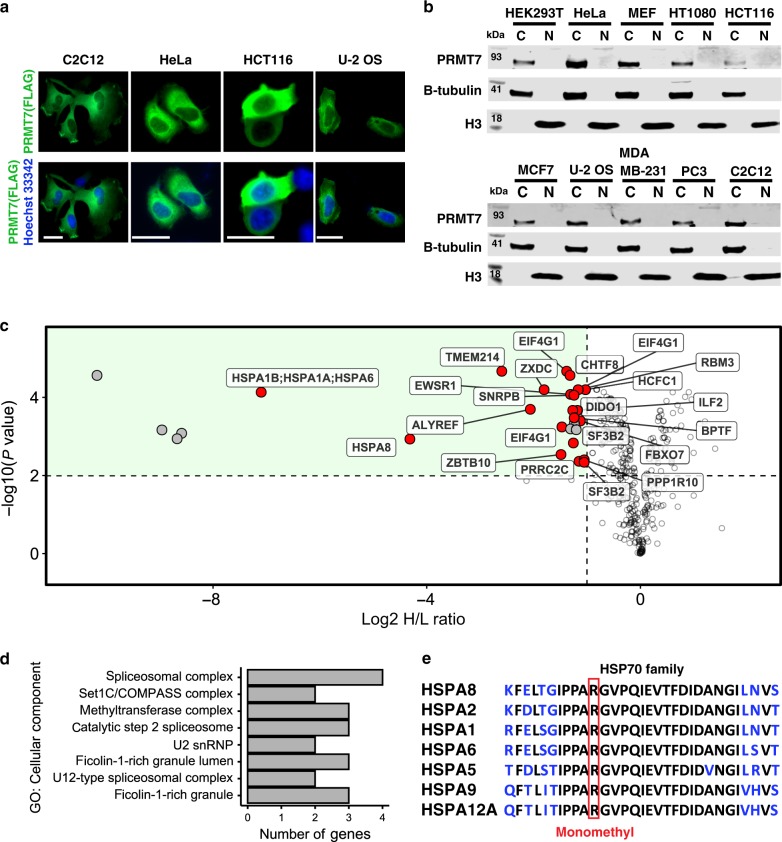
Fig. 2. Identification of PRMT7 substrates.
a Localization of exogenous FLAG-tagged PRMT7 as analyzed by immunofluorescence. Scale bar—25 µm. Green—FLAG, Blue—Hoechst dye (nucleus). The experiment repeated independently three times with similar results. b Cellular fractionation of endogenous PRMT7 in several cell lines. C cytoplasmic fraction, N nuclear fraction. Tubulin indicates β-Tubulin control. The experiment was repeated independently twice for HEK293T cells with similar results. c Volcano plot showing log2 heavy/light ratio of SILAC-labeled monomethyl arginine peptides from WT (L, unlabeled) relative to PRMT7 KO (H, heavy RK labeled) HCT116 cells. Dashed lines represent significance cut-offs of H/L ratio < −1 and adjusted p-value < 0.01 (n = 4). Labeled points, further highlighted in red, correspond to reported Rme1 sites found in the PhosphoSitePlus® v6.5.830. p-values from four independent replicates calculated by empirical Bayes moderated t-tests and adjusted using the Benjamini–Hochberg procedure as implemented in the Bioconductor package limma (v3.38.3)90. d Cellular component gene ontology terms associated with 27 significantly depleted arginine methylation events in PRMT7 KO relative to WT cells identified in c. e HSP family sequence alignment showing HSPA8 R469 resides in a highly conserved region where R469 is boxed in red. Source data are provided as a Source Data file.

