Fig. 1.
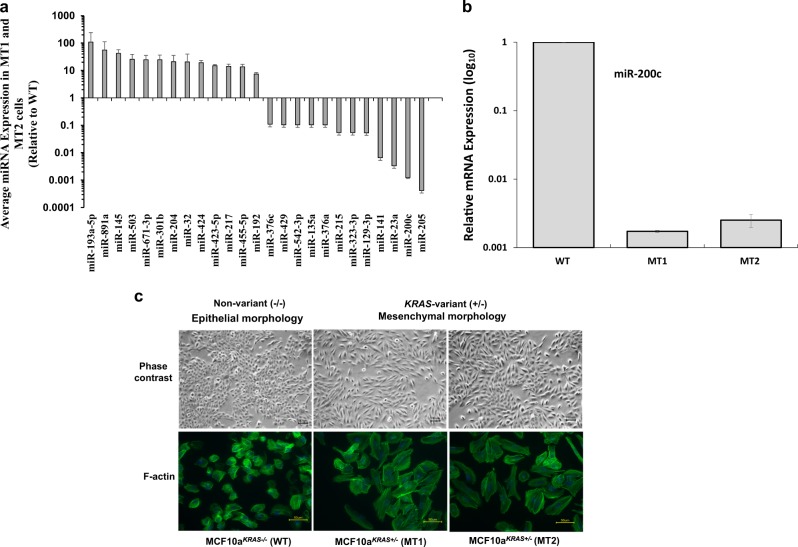
MicroRNA and phenotypic differences in KRAS-variant MT cells. a The KRAS-variant alters global microRNA expression. Representation of miRNA expression levels in MCF10A cells with (MCF10aKRAS+/−; MT1 and MT2) versus without (MCF10aKRAS−/−; WT) the KRAS-variant. b Relative mRNA expression of miR-200c in MCF10A cells with (MCF10aKRAS+/−; MT1 and MT2) versus without (MCF10aKRAS−/−; WT) the KRAS-variant at baseline as evaluated by qPCR. c Representative of phase contrast images (top; ×10 objective) and AlexaFluor 488-conjugated phalloidin staining of F-actin (bottom; ×40 objective) in MCF10A cells with (MT1 and MT2) versus without (WT) KRAS-variant grown as a monolayer. The size bars depict 100 and 50 µm length, respectively, in the images. Results of three independent experiments are shown (mean ± SEM). A Student’s t-test (two-tailed) was used to compare two groups and p < 0.05 was considered significant

