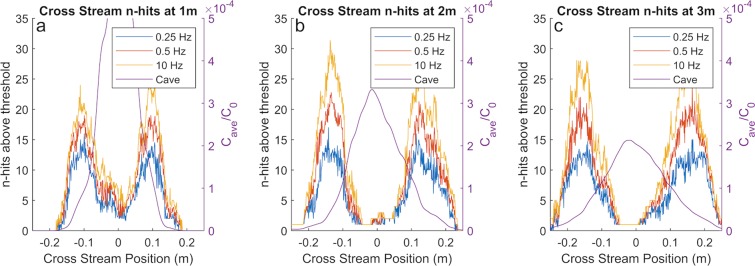
Figure 6.
Three cross sections of number of concentration spikes detected at an elevation of 3 cm above the bed, at downstream positions (a) 1 m, (b) 2 m, and (c) 3 m, overlaid with time averaged concentration, Cave. The threshold concentration used to filter concentration spikes was Cthresh/C0 = 3.16 × 10⁻⁵. Even at sampling frequencies of 0.25 Hz, elevated intermittency coincides with the plume edge. While faster sampling leads to a higher overall detected intermittency, it does not affect the cross-stream position of peak intermittency which can be utilized in a lobster while tracking the odorant plume.

