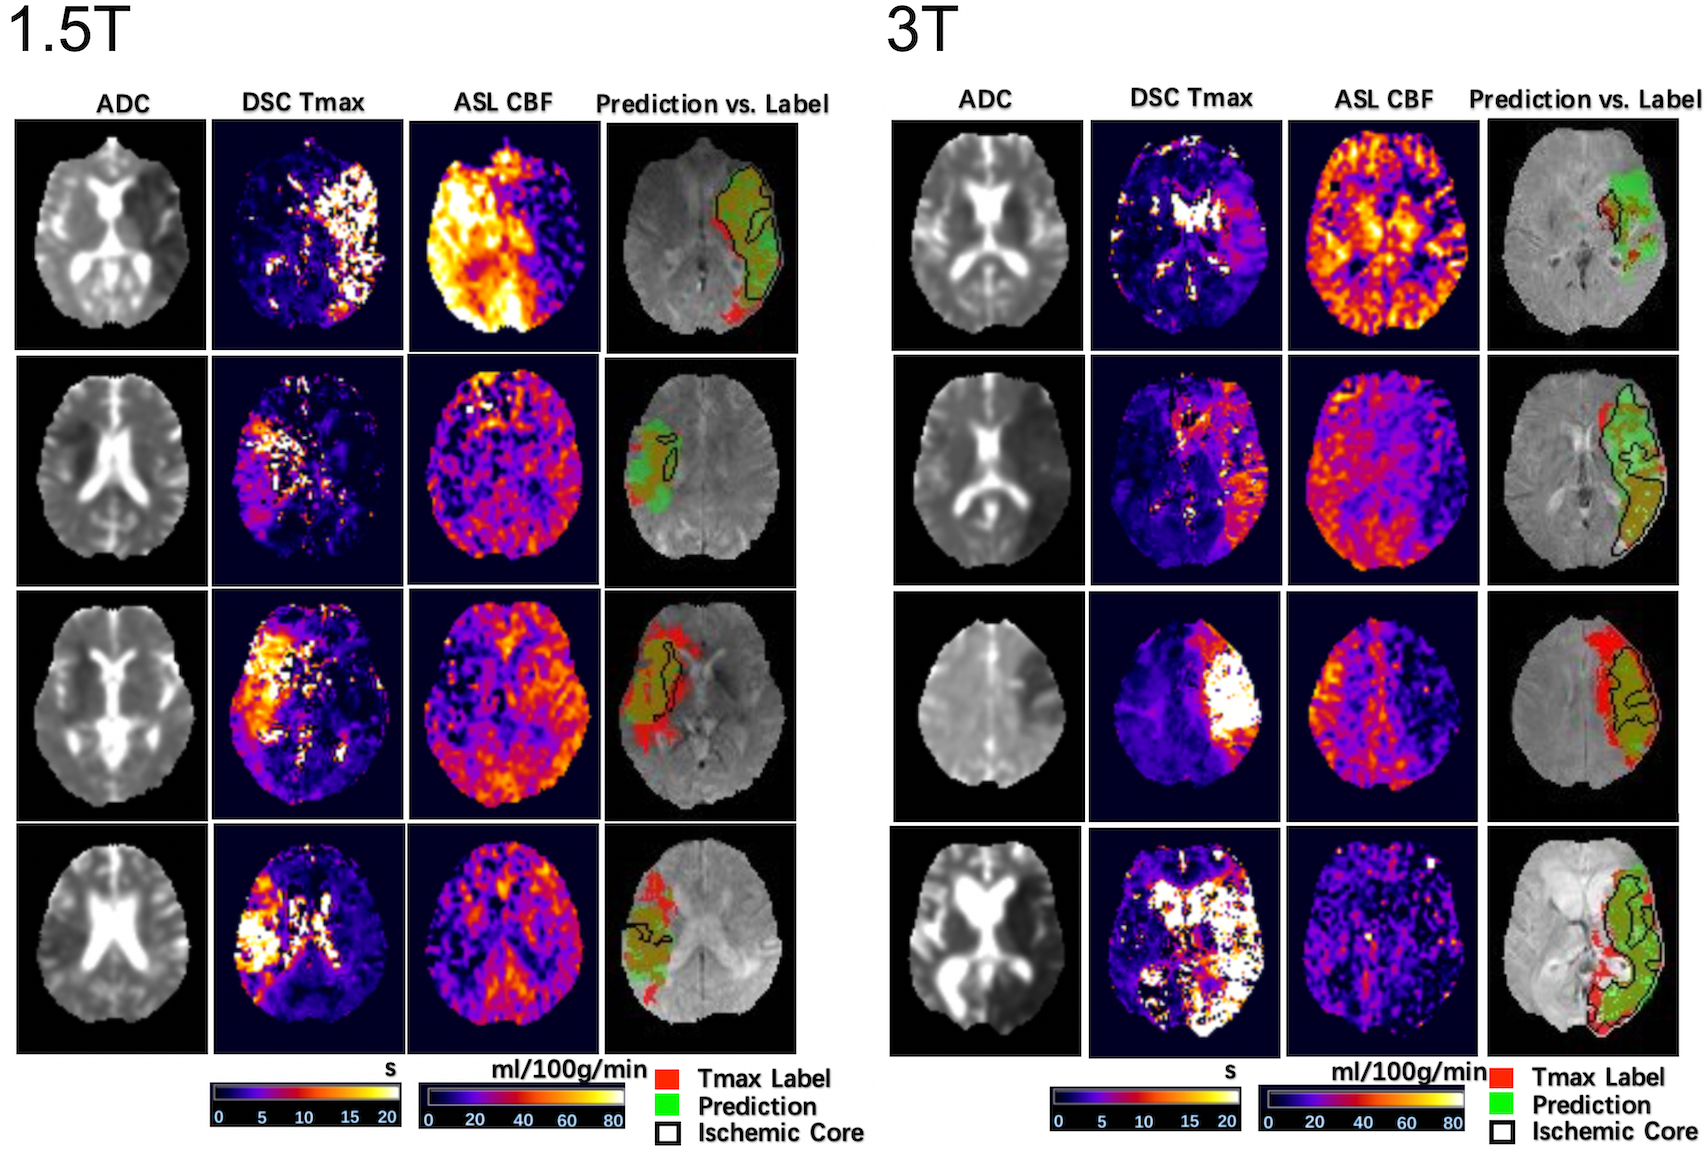
Figure 2. Four representative cases at each field strength showing the input images, label, and inference.

For each case, ADC, DSC Tmax, and ASL CBF are displayed in the first 3 columns, respectively. The predicted and Tmax label of perfusion lesions are overlaid on the T2w image of DWI. At each field strength, 2 cases with predicted>Tmax label perfusion lesion and 2 cases with predicted<Tmax label are shown. Only the second case of 1.5T was misclassified.
