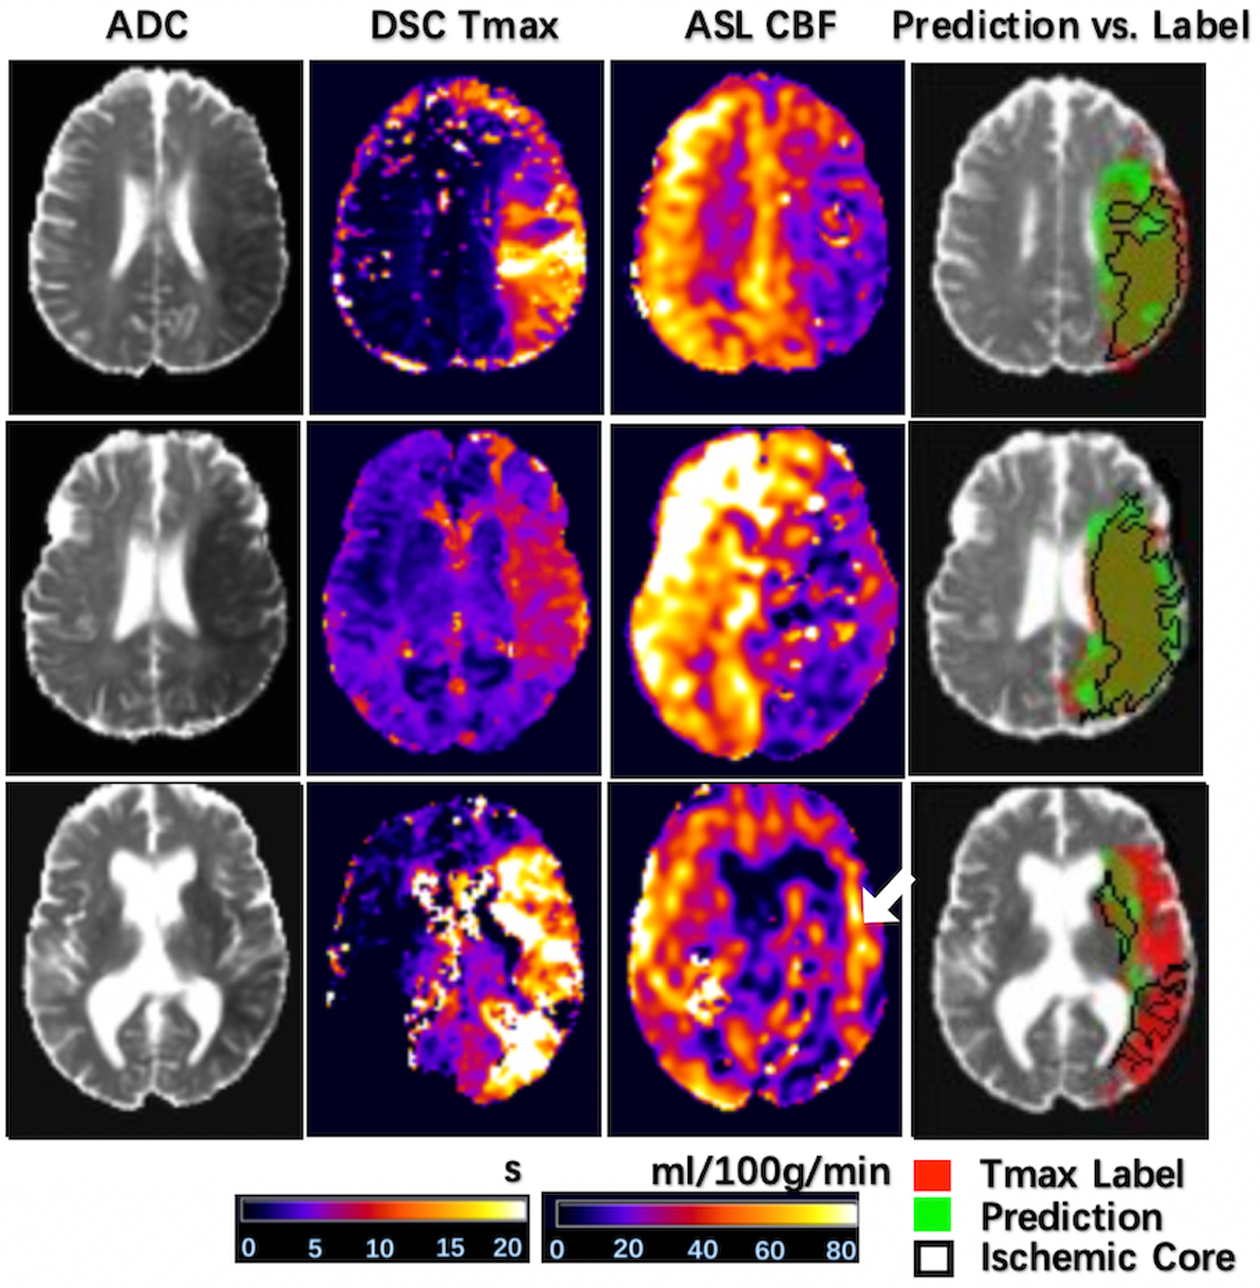
Figure 4. Three representative cases of the Stanford cohort showing the input images, inference, and label.

The same layout is used as in Figure 2. The first two were correctly classified, while the third one was misclassified. The arrow indicates hyperperfusion signal likely arising from delayed arterial transit effects.
