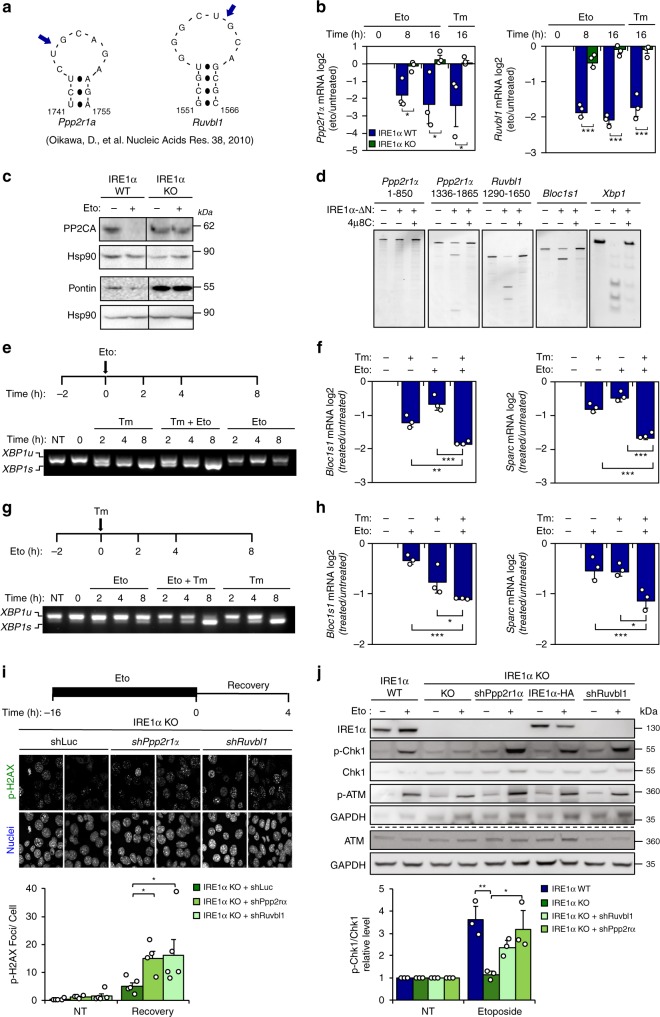
Fig. 3. IRE1α controls the stability of mRNAs involved in the DRR.
a Putative IRE1α cleavage sites on the Ppp2r1a and Ruvbl1 mRNAs (blue arrows). b WT and IRE1α KO MEF cells were treated with 10 μM etoposide (Eto). Ppp2r1a and Ruvbl1 mRNA levels were monitored by real-time-PCR. Treatment with 500 ng/mL tunicamicyn (Tm) as positive control (n = 3). c Cells were treated with 10 μM Eto (16 h) and PP2A and Pontin expression were monitored by western blot (n = 3). d In vitro RNA cleavage assay was performed using mRNA fragments of human Ppp2r1a and Ruvbl1, incubated in the presence or absence of recombinant cytosolic portion of IRE1α (IRE1α-ΔN) protein (30 min). Experiments were performed in presence or absence of IRE1α inhibitor 4μ8C. Blos1c1 and Xbp1 mRNA were used as positive controls. e Experimental setup (upper panel): MEF cells were pretreated with 100 ng/mL Tm for 2 h and then treated with 10 μM Eto. Xbp1 mRNA splicing was monitored by RT–PCR (bottom panel). f RIDD activity was monitored in samples described in e (n = 3). g Experimental setup (upper panel): MEF WT cells were pretreated with 10 μM Eto for 2 h and then treated with 100 ng/mL Tm. Xbp1 mRNA splicing was monitored by RT–PCR (bottom panel). h RIDD activity was monitored in samples described in g (n = 3). i IRE1α KO MEF cells were transduced with lentiviruses expressing shRNAs against Ppp2r1a (shPpp2r1a), Ruvbl1 (shRuvbl1) or luciferase (shLuc). Cells were incubated with 1 μM Eto (16 h), washed three times with PBS and fresh media was added. P-H2AX levels were monitored by immunofluorescence after 4 h. P-H2AX foci quantification is shown (Bottom panel) (>200 cells, n = 4–5). j WT, IRE1α KO and reconstituted with IRE1α-HA, expressing shRuvbl1, shPpp2r1a or shLuc cells were treated with 5 μM Eto for 8 h and P-CHK1 and P-ATM monitored by western blot. P-CHK1 quantification is shown (bottom panel) (n = 3). All panels data is shown as mean ± s.e.m.; *p < 0.05, **p < 0.01, and ***p < 0.001, based on b two-way ANOVA followed Bonferroni’s test, (f, h–j) One-way ANOVA followed Tukey’s test. Data is provided as a Source Data file.

