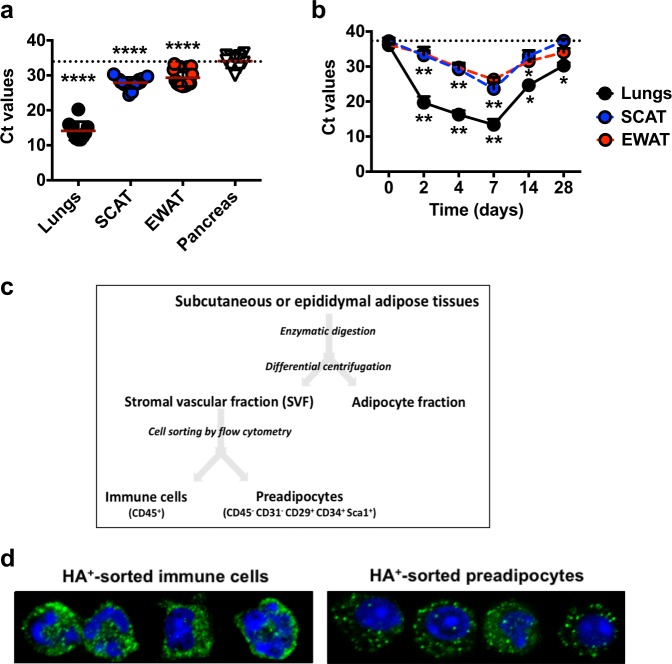
Fig. 5. Viral protein-expressing cells are detected in adipose tissues.
a Viral RNA levels (expressed as cycle threshold (Ct) values) in the lungs, SCAT, EWAT, and pancreas at 7 dpi. Lungs and pancreas from n = 10 IAV-infected animals, and SCAT and EWAT from n = 25 IAV-infected animals. The dotted line indicates pancreas’ mean Ct value. Individuals values, as well as means ± SD are shown. ****p < 0.0001. b Viral RNA levels (expressed as Ct values) in the lungs, SCAT, and EWAT from mock-treated and IAV-infected mice, at 0, 2, 4, 7, 14, and 28 dpi, n = 5 mock-treated animals and n = 8 IAV-infected animals per time point. The dotted line indicates day 0 of infection. Data are expressed as mean ± SD. *p < 0.05, **p < 0.01. c Fractionation procedure used to separate stromal vascular fraction (SVF) cells from mature adipocytes, of the adipose tissues. Immune cells (characterized as CD45+ cells) and preadipocytes (characterized as CD45− CD31− CD29+ CD34+ Sca-1+ cells) from the SVF were then sorted by flow cytometry (see gating strategy Supplementary Fig. 5b). d A selection of sorted immune cells and preadipocytes expressing the viral protein hemagglutinin (green) observed by immunofluorescence and confocal microscopy. The nuclear counterstain DAPI was used (blue). All images were taken at ×63 magnification, n = 3 mock-treated animals and n = 6 IAV-infected animals. Differences between pancreas and lungs, pancreas and SCAT and pancreas and EWAT (a) and between day 0 and days 2, 4, 7, 14, or 28 (b) were considered significant when p < 0.05.

