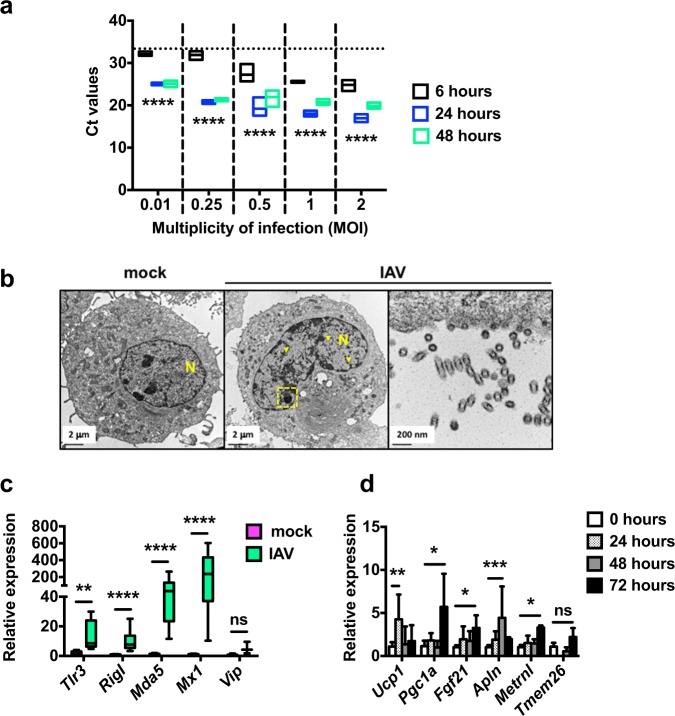
Fig. 6. Influenza induces brown-like adipogenesis in preadipocytes.
a Viral RNA levels (expressed as Ct values) in IAV-infected preadipocytes (3T3-L1 cells) (MOI of 0.01, 0.25, 0.5, 1, or 2) at 6, 24, and 48 h post-infection (hpi), n = 4 biologically independent samples per condition. The dotted line indicates the 6 hpi/0.01 MOI mean Ct value. ****p < 0.0001. b Representative transmission electron microscopy sections of mock-treated and IAV-infected preadipocytes (MOI of 5, 24 hpi), n = 3 biologically independent samples per condition. Classical nuclear (yellow arrowheads) and nucleolar (yellow dashed frame) fingerprints associated with IAV infection are shown. A detailed view of empty viral particles at budding regions is presented. N = nucleus. c Relative mRNA expression (RT-qPCR) of the antiviral innate-immune-related genes Tlr3, RigI, Mda5, Mx1, and Vip in mock-treated and IAV-infected preadipocytes (MOI of 1, 24 hpi). For Tlr3 and Vip: n = 5 biologically independent samples per condition. For RigI, Mda5, and Mx1: n = 7 biologically independent mock-treated preadipocyte samples and n = 18 biologically independent IAV-infected preadipocyte samples. **p < 0.01, ****p < 0.0001, ns = not significant. d Relative mRNA expression of the genes involved in the browning-like/beiging adipogenesis process Ucp1, Pgc1a, Fgf21, Apln, Metrnl, and Tmem26 in mock-treated and IAV-infected preadipocytes at 24, 48, and 72 hpi (MOI of 1), n = 6 biologically independent samples per condition. Of note, for Tmem26 expression, the 24 hpi time was not done. Data are expressed as mean ± SD. *p < 0.05, **p < 0.01, ***p < 0.001, ns = not significant. Differences between 6 and 24 hpi and between 6 and 48 hpi (a), and between mock-treated and IAV-infected groups (c, d) were considered significant when p < 0.05.

