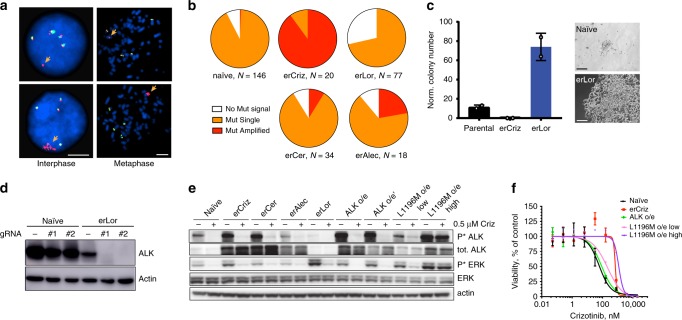
Fig. 4. Impact of ALK mutation and amplification on TKI sensitivity.
a Representative images for interphase and metaphase FISH analysis for EML4-ALK fusion and amplification status. Separation of 3′ (red) probe from 5′ (green) probe indicates ALK fusion event (orange arrows). The scale bars represent 5 μm. b Frequency of cells with the indicated EML4-ALK fusion and amplification status in the gradually evolved erALK-TKI cell lines (lines 0 were analyzed). c Impact of CRISPR-mediated genetic ablation of ALK on clonogenic survival of the indicated H3122 derivates. Mean ± SD of experimental duplicates, representing separate dishes with alternative ALK directed guide RNAs; representative colonies are shown. The scale bars represent 100 μm. d Evaluation of EML-ALK ablation by immunoblotting analysis. Raw images shown in Supplementary Fig. 14. e Immunoblot evaluation of the expression and activity of EML4-ALK oncogenic signaling in the presence of Crizotinib or after 48 h of drug holidays, for the indicated cell lines with evolved and engineered resistance. ALK o/e and ALK o/e' denote independently derived sublines. Raw images shown in Supplementary Fig. 15. f Impact of retrovirally mediated overexpression of EML4-ALK fusion and its L1196M mutant variant on sensitivity to crizotinib, measured by Cell Titer Glo assay. Mean ± SD of experimental triplicates representing separate wells are shown.

