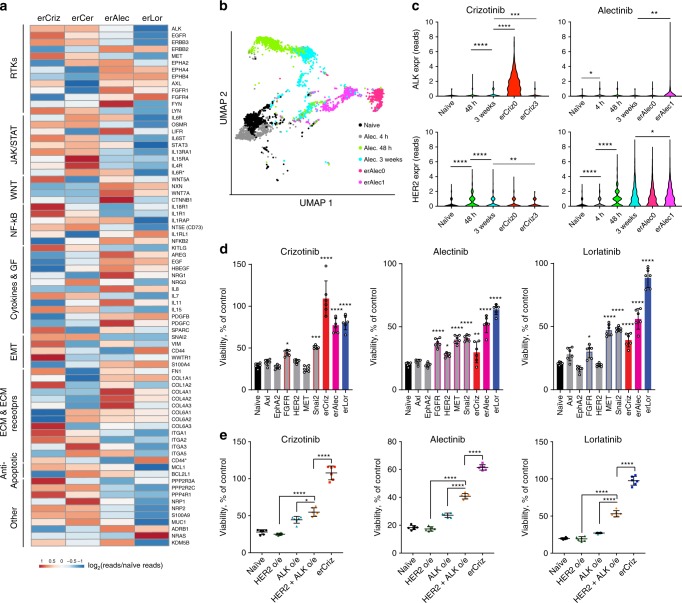
Fig. 5. ALK-TKI resistance integrates multiple mechanisms.
a Normalized mRNA expression for the indicated genes, previously associated with chemotherapy or targeted therapy resistance, in erALK-TKI cell lines across the indicated functional categories. b UMAP analysis of single-cell mRNA expression data from cells exposed to 0.5 μM alectinib for the indicated time duration. c Violin plot of expression levels of ALK and HER2 following indicated duration of exposure to the indicated ALK-TKIs. *p < 0.05, **p < 0.01, ***p < 0.001, and ****p < 0.0001 of a Mann–Whitney U-test. d ALK-TKI sensitivity of engineered cell lines, lentivirally overexpressing indicated genes to the indicated ALK-TKIs (0.5 μM), as determined by Cell Titer Glo assay. Mean ± SD of experimental replicates (n = 6, representing separate wells) are shown. e Impact of combination of individual resistance mechanisms toward sensitivity to indicated ALK-TKIs (0.5 μM), determined by Cell Titer Glo assay. *p < 0.05, **p < 0.01, ***p < 0.001, and ****p < 0.0001 of ANOVA analysis with Dunnett’s (d) or Tukey’s (e) multiple comparison correction. Mean ± SD of experimental replicates (n = 6, representing separate wells) are shown.

