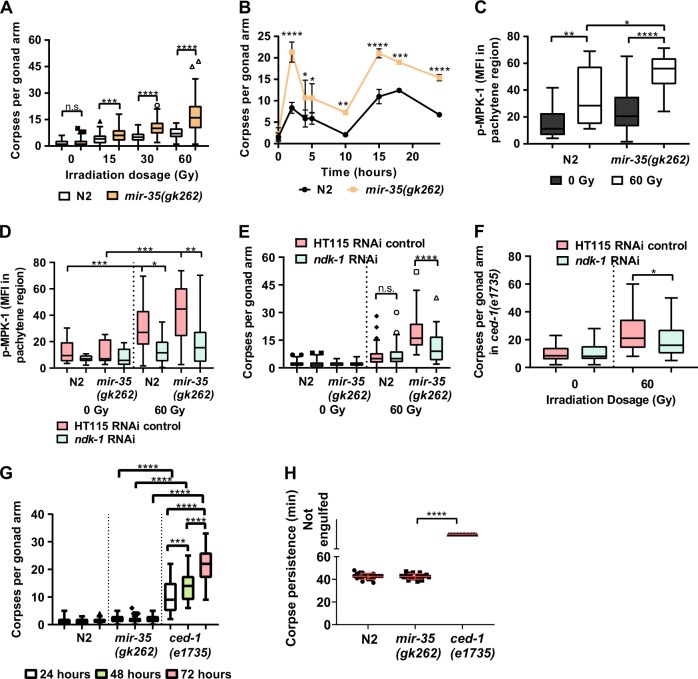
Fig. 1.
Inappropriate activity of NDK-1 in mir-35(gk262) mutant result in increased MAPK activity and germ cell death after exposure to genotoxic stress. Number of corpses at a different irradiation dosages in N2 and mir-35-41(gk262) mutant (P < 0.001 (****), P = 0.0002 (***), n.s. = not significant) and b at 60 Gy for the indicated times (P < 0.0001 (****), P = 0.0005 (***), P = 0.0076 (**), P < 0.01 (*)). Mean fluorescence intensity (MFI) of the pachytene region was determined in isolated germlines stained for p-MPK-1 c without RNAi treatment (P < 0.0001 (****), P = 0.0025 (**), P = 0.01 (*)) or d with RNAi treatment (P < 0.0004 (***), P = 0.0012 (**), P = 0.01 (*)). Refer to Supplementary Fig 1 and 2, respectively, for representative images used in quantifying p-MPK-1. e Corpses numbers in N2 and mr-35(gk262) worms fed with the indicated RNAi and irradiated at young adult (P < 0.0001 (****), n.s. = not significant). f ced-1(e1735) on the indicated RNAi and irradiated at young adult (P = 0.0174 (*)). Corpses were determined 24 h after irradiation (n ≥ 30 worms in three independent replicates). g Germ cell corpses and h cell corpse persistence was determined in unirradiated N2, mir-35(gk262) and ced-1(e1735) worms at 24, 48 and 72 h post-L4. P < 0.0001 (****), P = 0.0007 (***). Graphs are plotted as whisker and box plot to illustrate data distribution with symbols indicating outliers based on Tukey’s test. Part (b) is a line plot with error bars indicating SEM. Part (h) is a scatter plot with errors, illustrated in red for visual ease, indicating SEM

