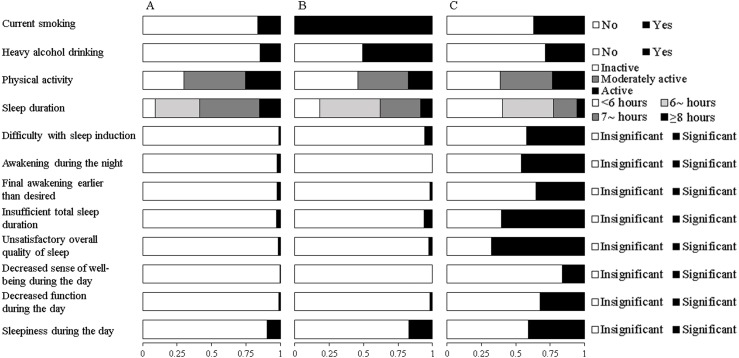
Figure 1. Estimated response probabilities for health risk behaviors within the three classes among males.
(A) Healthy lifestyle (Class 1, 62.9%). (B) Cumulate harmful habits (Class 2, 27.1%). (C) Poor sleep and risky habits (Class 3, 10.0%). The bars represent the response probabilities (0 to 1.0) for each item in respective class.

