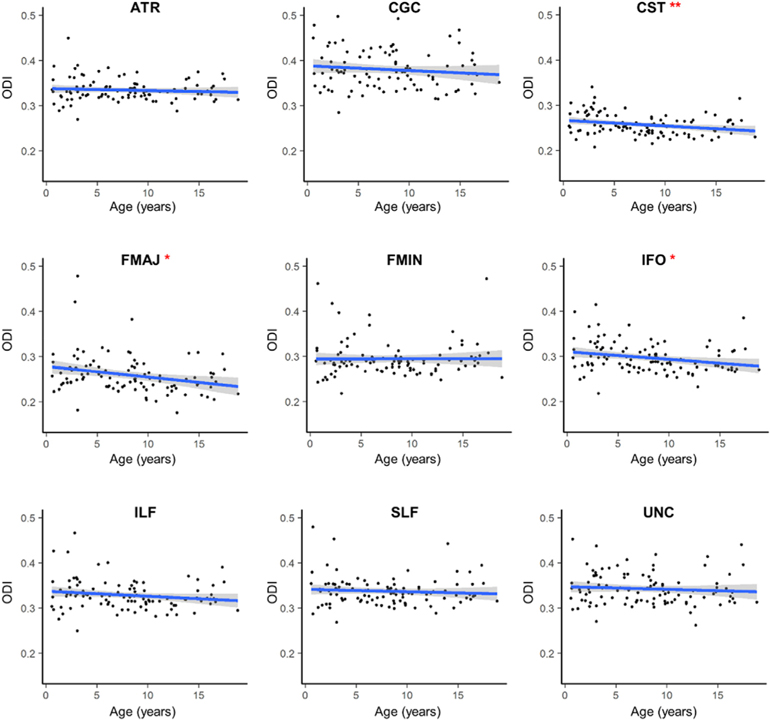
Fig. 2. Age-related changes in mean ODI for major white matter tracts.
ODI values are averaged across the left and right hemispheres for each tract. Regression line shows the best fit line relating age and ODI. Age was significantly and negatively associated with age in the CST, FMAJ and IFO only. *p < .05; **p < .01.

