Figure 5.

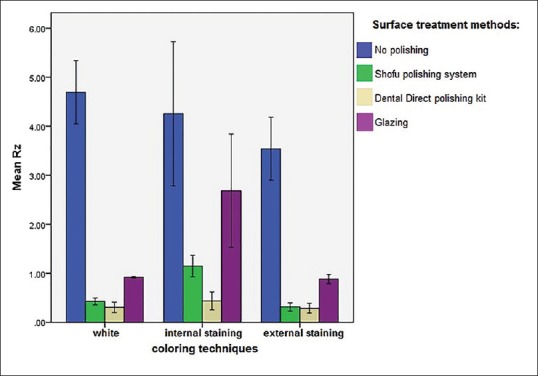
The mean and standard deviation of Rz (μm) of all subgroups affected by different surface treatment methods and coloring techniques.

The mean and standard deviation of Rz (μm) of all subgroups affected by different surface treatment methods and coloring techniques.