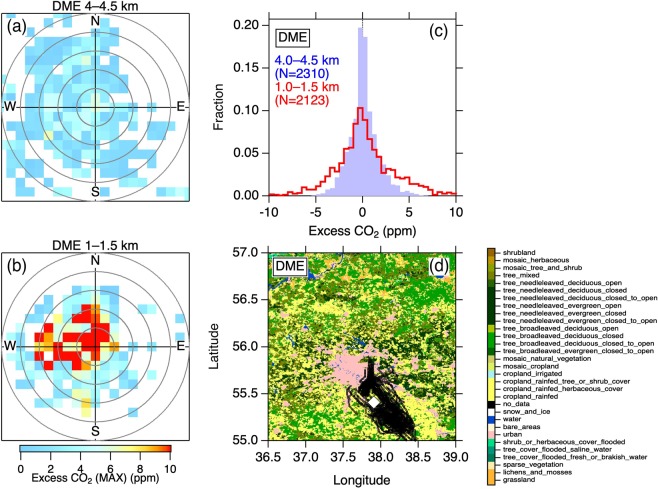
Figure 1.
Variability of atmospheric CO2 enhancement over Moscow Domodedovo Airport (DME). (a,b) Maximum excess CO2 values observed in wind direction (angle) and speed (distance from the center) bins at 4.0–4.5 km and 1.0–1.5 km altitude (a.g.l.), respectively. Circles in grey represent every 5 m s−1 wind speed. (c) Histograms of excess CO2 at 4.0–4.5 km (solid purple) and 1.0–1.5 km (solid red line) altitudes. Note that excess CO2 = 0 means that the CO2 data point lies close to the climatological seasonal variation over the airport, whereas large deviations indicate excursion from the representative seasonal variation. (d) The CO2 measurement positions at altitudes of <2 km (black circles). The open diamond is the location of DME. The land cover data are from a global land cover map product36 and the map was generated by Igor Pro 7 (https://www.wavemetrics.com).

