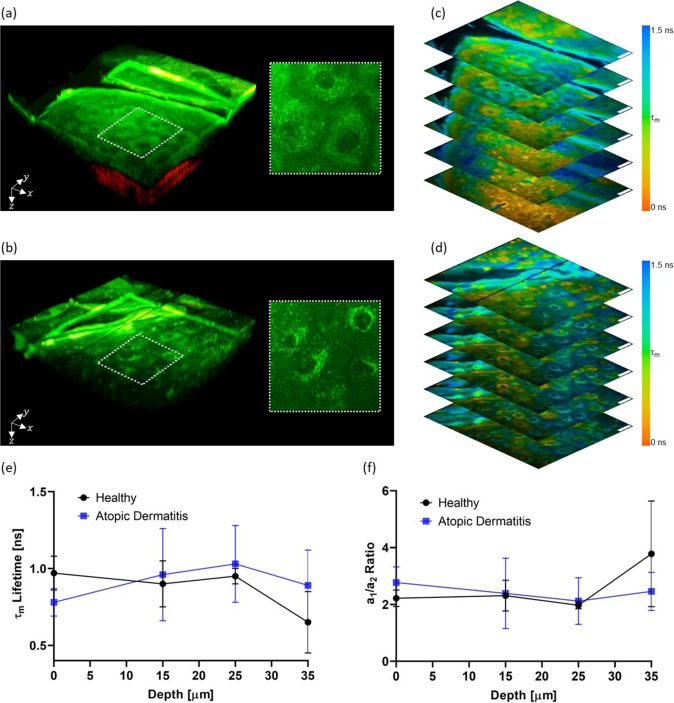
Figure 2.
Autofluorescence intensity and lifetime analysis. Three-dimensional representation of the skin autofluorescence (green) and second-harmonic generation (red) for healthy volunteers (a) and atopic dermatitis patients (b) with highlighted regions showing cell morphology and corresponding FLIM images (c and d, respectively). FLIM images are color-coded for the mean autofluorescence (τm) lifetime as indicated in the color bar and autofluorescence intensity weighted. Scale bar = 20 µm. Changes with depth of τm lifetime (c) and a1/a2 ratio (d) in the living cell layers of healthy and atopic dermatitis diagnosed skin. FLIM images were analyzed using the commercial software SPCImage v8.0 (Becker & Hickl GmbH, Berlin, Germany).

