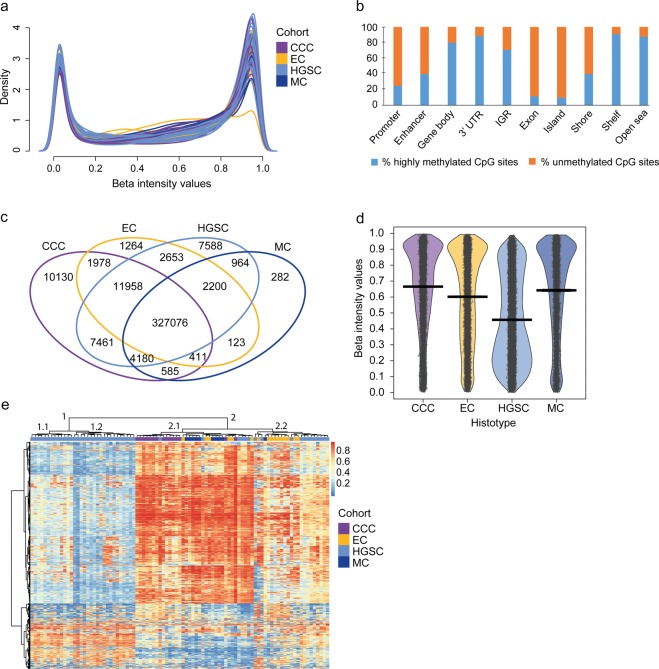
Figure 1.
DNA methylation pattern in ovarian carcinoma. DNA methylation density plot (a) showing the beta value distribution of individual probes (n = 679,259) after batch correction colored by the ovarian carcinoma histotypes (clear-cell (CCC), endometrioid (EC), high-grade serous (HGSC) and mucinous (MC) ovarian carcinomas). Overall, more highly methylated probes were identified in the cohort. The x-axis denotes beta intensity values and the y-axis density. Column chart (b) showing an overview of the relative distribution of methylation patterns across genomic regions. Unmethylated CpG sites were more common in the promoter, enhancer, exon, CpG island and shore, while highly methylated CpG sites were prevalent in the gene body, 3′ UTR, IGR, shelve and open sea. Venn diagram (c) showing unique and overlapping differentially methylated probes (DMPs) between histotypes (P value<0.05). The highest number of unique DMPs was identified in CCCs, whereas 300,406 DMPS were not differentially methylated in any histotype comparison. RDI (Raw data, Descriptive, Inference statistics) plot (d) showing the difference in methylation patterns between histotypes for the 1,000 most variable probes. Black open circles distributed horizontally represent raw data probes and the surrounding colored beans depict smoothed densities. A large proportion of probes were methylated in CCC (mean depicted by the black vertical center bar), whereas probes were predominantly unmethylated in HGSCs. Significant differences in DNA methylation patterns were found for all histotypes (Wilcoxon test). CCC vs MC comparison had a P value<0.01 and the remaining comparisons had P values<0.0001. Heatmap (e) of DNA methylation beta values for the 1,000 most variable probes across the cohort. Red color represents highly methylated probes and blue color unmethylated probes. Ward’s method was used for the hierarchical clustering of histotypes (colored bar at the top of the heatmap) and Canberra distance measure was used to calculate the dissimilarity measure for the heatmap. On the left side of the heatmap the 1,000 CpG sites are clustered into two main clusters.

