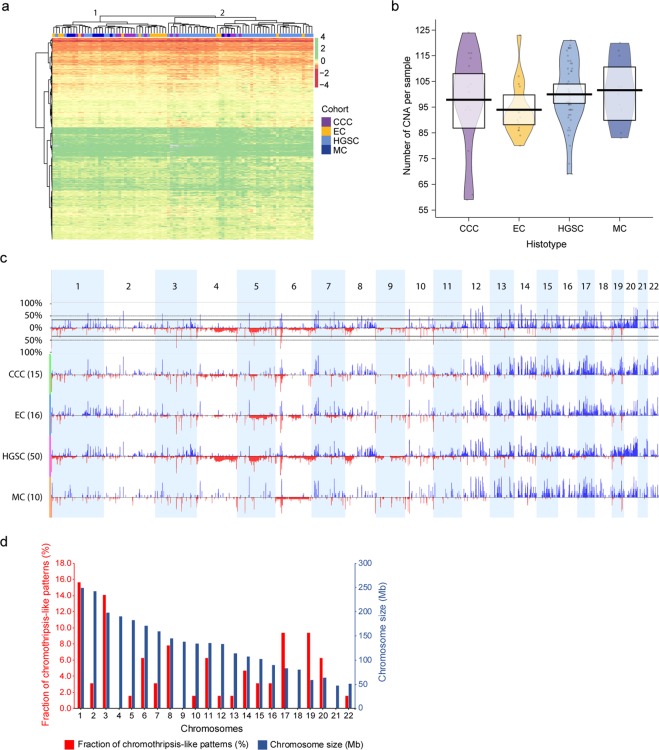
Figure 3.
DNA copy number alteration patterns and genomic imbalances. Heatmap (a) showing probes (n = 6,651) spanning regions of DNA copy number alterations (CNAs) in at least 35% of the patient samples. All histotypes were distributed across both main clusters (clusters 1 and 2). Moreover, no clear differences in CNA patterns were found in the two main clusters (clusters 1 and 2). Gains are denoted in green color and losses in red color. Gray color denotes missing values (NAs). Canberra distance measure was used to calculate the distance between probes and the Ward method was applied for hierarchical clustering of the histotypes (colored bar at the top of the heatmap). RDI plot (b) showing the average number of CNA per patient sample in the respective histotypes, with the greatest mean identified for MC (101.6, range: 83–120) followed by HGSC (100.0, range: 69–121), CCC (97.9, range: 59–124) and EC (94, range: 80–123). All comparisons were non-significant, except for the comparison between EC and HGSC CNAs (Wilcoxon P value<0.05). Black open circles distributed horizontally represent raw data probes and the surrounding colored beans depict smoothed densities thereof. Genome-wide frequency plots (c) showing CNAs identified in the patient cohort as a whole (top frequency plot) and stratified by histotype (CCC, EC, HGSC, and MC). Chromosomes 1 to 22 are shown in alternating blocks of light blue. Genomic gains are illustrated in blue and genomic losses in red. Bar chart for chromothripsis-like patterns (CTLP) in ovarian carcinoma (d) showing the frequency of CTLPs (red). Blue bars show the respective sizes in Megabases (Mb) for chromosomes 1 to 22. Default settings were applied for the CTLPScanner with absolute threshold values for gains and losses set at 0.3. The highest frequency of CTLPs were identified on chromosomes 1, 3, 17 and 19.

