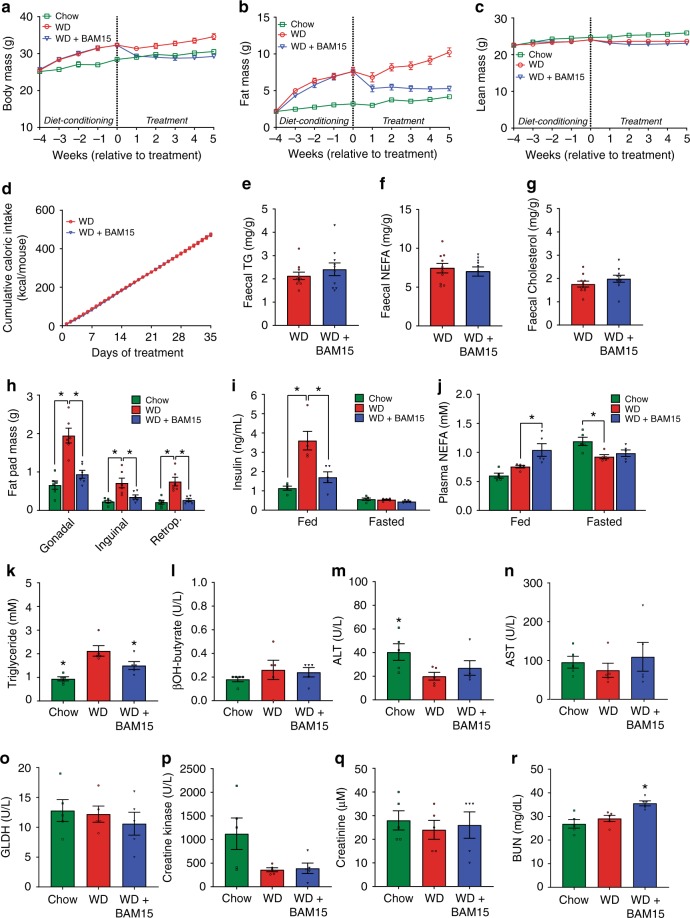
Fig. 4. BAM15 reverses diet-induced adiposity without affecting lean mass or caloric intake.
a–d Body mass, fat mass, lean mass, and cumulative food intake were recorded over the course of the study, n = 21 animals from four independent studies (except Week 1 fat mass and lean mass, n = 17 animals from three independent studies). e–g Fecal triglyceride, NEFA, and cholesterol levels comparing WD to WD + BAM15, n = 10 animals from two independent studies. Significance tested by two-tailed Student’s t test. h Final fad pad masses, n = 6 animals from one study. Asterisk (*) indicates p < 0.05 for each fat pad compared with WD, determined by one-way ANOVA. Exact p values as follows—Gonadal: Chow, p < 0.0001; WD + BAM15, p = 0.0003. Inguinal: Chow, p = 0.0015; WD + BAM15, p = 0.0125. Retroperitoneal: Chow, p = 0.0002; WD + BAM15, p = 0.0007. i, j Fed and 12 h fasted plasma insulin and NEFA concentrations, n = 5 animals from one study. Asterisk (*) indicates p < 0.05 for each treatment compared with WD, determined by two-way ANOVA. Exact p values as follows—Fed insulin; Chow and WD + BAM15, p < 0.0001. Fed NEFA; WD + BAM15, p = 0.0066. Fasted NEFA; Chow, p = 0.0118. Terminal plasma (k) triglyceride, (l) β-hydroxybutyrate, (m) ALT, (n) AST, (o) GLDH, (p) creatine kinase, (q) creatinine, and (r) BUN n = 5 animals from one study. Significance determined by one-way ANOVA, Asterisk (*) indicates p < 0.05 compared to WD. Exact p values as follows—Triglyceride: Chow, p = 0.0006; WD + BAM15, p = 0.0417. ALT: Chow, p = 0.0483. BUN: WD + BAM15, p = 0.0140. All data presented as mean values ± SEM. Colour scale: green—Chow, red—Western diet (WD), electric blue—WD + BAM15 0.10%. Source data provided in Source data file.

