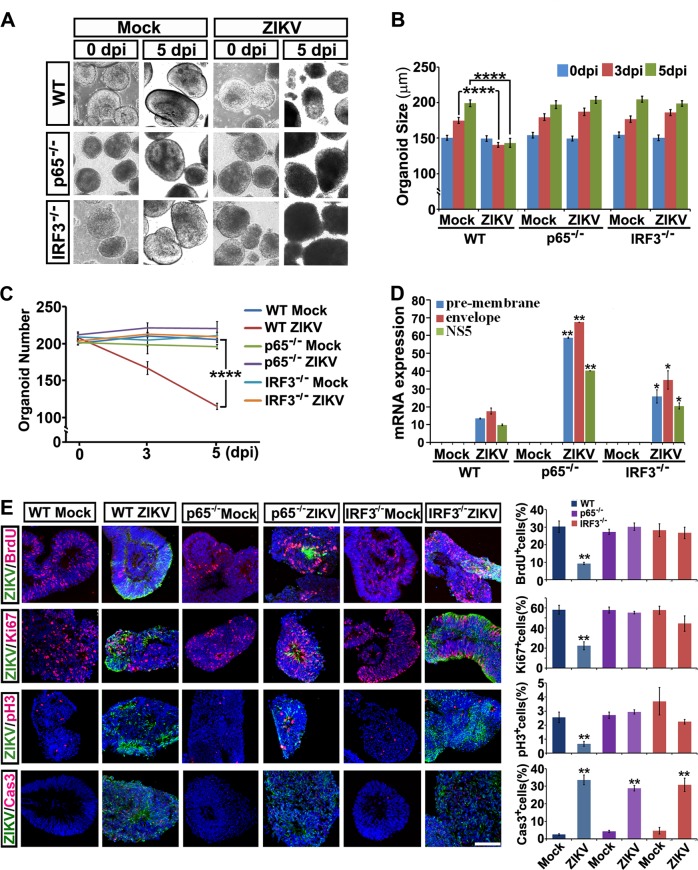
Fig. 7.
Knockout of p65 or IRF3 in hESCs protects brain organoids from ZIKV infection-induced neuropathy. a Light images of FD organoids differentiated from WT, p65 or IRF3 KO hESCs exposed to mock conditions or ZIKV at MOI = 0.5 at 0 or 5 dpi. b Size of WT, p65 or IRF3 KO FD organoids exposed to mock or ZIKV at MOI = 0.5 at 0, 3 or 5 dpi. Quantification data are presented as mean ± SEM. n = 200 from three independent experiments. Unpaired two-tailed Student’s t-test. ****p < 0.0001 compared to mock controls. c Number of WT, p65 or IRF3 KO organoids remaining with mock or ZIKV infection at MOI = 0.5 at 0, 3 or 5 dpi. Quantification data are presented as mean ± SEM. n = 3. Unpaired two-tailed Student’s t-test. ****p < 0.0001 compared to the mock control. d qRT-PCR analyses of ZIKV pre-membrane, envelope and NS5 mRNAs relative to GAPDH extracted from WT, p65 or IRF3 KO organoids infected with ZIKV at 0.5 MOI or mock control at 5 dpi. Quantification data are presented as mean ± SEM. n = 3. Unpaired two-tailed Student’s t-test. *p < 0.05, **p < 0.01 compared to the corresponding WT controls. e Confocal images stained with ZIKV envelope proteins in green, or BrdU, Ki67, pH3 and cleaved Caspase 3 in red of mock or ZIKV-infected WT, p65 or IRF3 KO organoids at 5 dpi. Scale bar, 100 μm (left). Quantitative analyses of percentage of BrdU, Ki67, pH3 and cleaved Caspase 3 positive cells of WT, p65 or IRF3 KO organoids in mock or ZIKV groups (right). Data are presented as mean ± SEM. n = 3. Unpaired two-tailed Student’s t-test. **p < 0.01 compared to corresponding mock controls

