Figure 2.
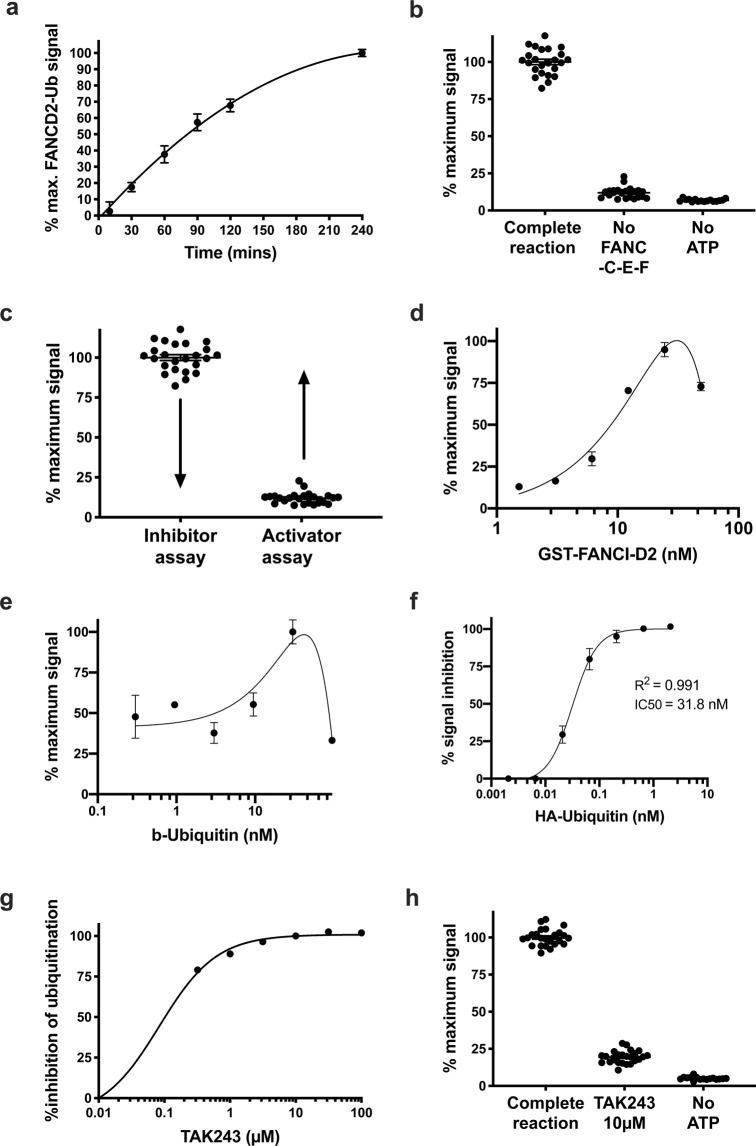
FANCD2-mono-ubiquitination proximity assay parameters. (a) Time point ubiquitination assay perform using the proximity assay. (b) Demonstration of the controls used for the FANCD2-ubiquitination activator screen. The first condition “complete reaction” represent the FANCD2 mono-ubiquitination reaction with FANCT, FANC-B-L-100, FANC-C-E-F, FANCI, FANCD2 and dsDNA. The second condition and third conditions omit the substrate adaptor FANC-C-E-F (Z′ = 0.57) and ATP respectively. (c) Implementation of the two assay conditions to screen for inhibitors and activators of FANCD2 mono-ubiquitination. Arrows highlight that maximal ubiquitination levels will be exploited for the identification of inhibitors and basal levels of ubiquitination will be exploited for the identification of activators. (d) Titration of GST-FANCI-D2 complex through the proximity assay. (e) Titration of biotinylated-ubiquitin through the FANCD2-ubiquination proximity assay. (f) Titration of HA-Ubiquitin through the proximity assay of FANCD2-ubiquination, inhibiting the signal by 50% at a concentration of 31.8 nM. (g) Titration of TAK243, which is a ubiquitin-activating-enzyme (UbE1) inhibitor, through the proximity assay. TAK243 is used as an inhibitor control for the inhibitor screen. (h) Demonstration of the controls used for the FANCD2-ubiquitination inhibitor screen, Z′ = 0.79.

