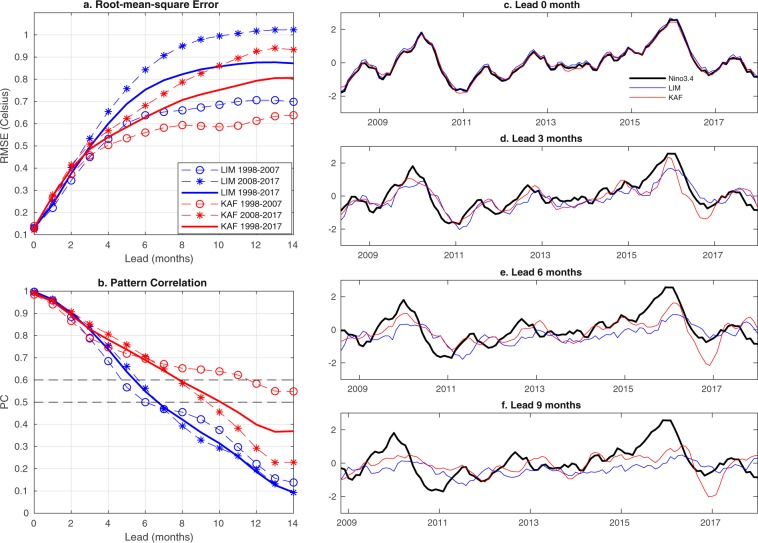
Figure 1.
Forecasts of the Niño 3.4 index in industrial-era HadISST data during 1998–2017 obtained via KAF (red) and LIM (blue). (a,b) RMSE and PC scores, respectively, as a function of lead time, computed for 1998–2007 ( markers), 2008–2017 (* markers), and the full 1998–2017 verification period (solid lines). The 0.6 and 0.5 PC levels are highlighted in (b) for reference. (c–f) Running forecasts for representative lead times in the range 0–9 months. Black lines show the true signal at the corresponding verification times.

