
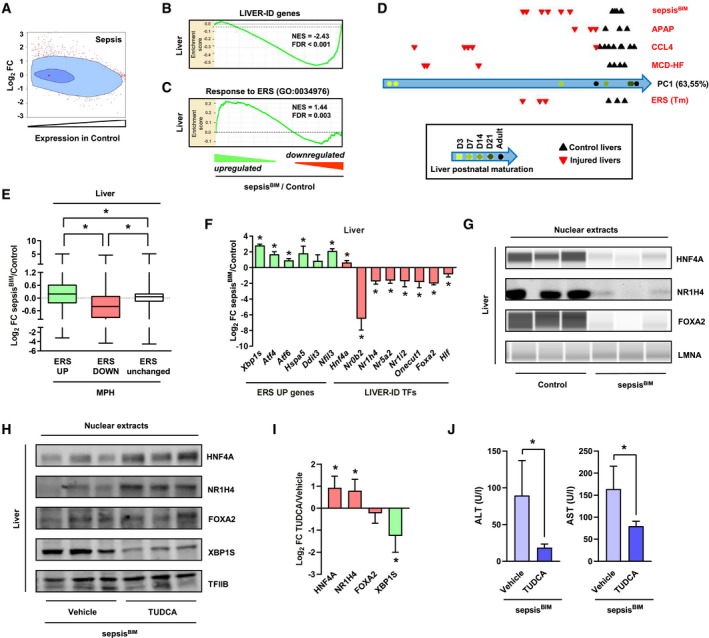
Figure 6. ERS contributes to LIVER‐ID gene downregulation and loss of hepatic identity in septic mice.
-
ASimilar analysis as in Fig 1C using transcriptomic data from the liver of sepsisBIM mice (16 h after intraperitoneal injection of live E. coli).
-
B, CEnrichment plots from GSEA performed using LIVER‐ID genes (B) or the response to ERS gene set (GO:0034976) (C) as the gene set and transcriptomic differences in sepsisBIM vs control mouse liver as the ranked gene list.
-
DComparison of the transcriptome of the indicated liver injury models (details are provided in Appendix Fig S20 and Table EV6) with that of the developing mouse liver performed as described in the Materials and Methods. PC1 is the first principal component which represents 63.55% of the variability within the mouse liver differentiation study. PC1 was used to project the liver injury studies. APAP, acetaminophen overdose—model of drug‐induced acute liver injury. CCL4, carbon tetrachloride hepatotoxicity—model of drug‐induced chronic liver injury. MCD‐HF, methionine–choline‐deficient diet with high fat—model of NASH/fibrosis.
-
EBox plots showing Log2 FC for ERS UP, DOWN, or unchanged genes in sepsisBIM vs control mouse liver (6 mice per group). Box plots are composed of a box from the 25th to the 75th percentile with the median as a line and min to max as whiskers. One‐way ANOVA with Welch's correction and Dunnett's modified Tukey–Kramer pairwise multiple comparison test was used to assess statistical significance, *P < 0.05.
-
FRT–qPCR analyses of selected ERS UP genes and LIVER‐ID TFs monitoring expression changes in the liver of sepsisBIM vs control mice (6 mice per group). The bar graph shows means ± SD (standard deviations). One‐sample t‐test with BH correction for multiple testing was used to determine whether the mean Log2 FC sepsisBIM/control is statistically different from 0, *P < 0.05.
-
GNuclear extracts from livers of control or sepsisBIM mice were subjected to Western blot or Simple Western immunoassay with antibodies against HNF4A, NR1H4, or FOXA2. LMNA was used as loading control.
-
HNuclear extracts from livers of sepsisBIM mice pre‐treated for 4 consecutive days with vehicle or 500 mpk TUDCA were subjected to Western blot with antibodies against HNF4A, NR1H4, FOXA2, or XBP1S. TFIIB was used as loading control. Additional mice are shown in Appendix Fig S22D.
-
IDensitometric quantification of the protein expression data from 6 mice per condition shown in panel (H) (3 mice per condition) and Appendix Fig S22D (3 additional independent mice per condition). The bar graph shows means ± SD (standard deviations). One‐sample t‐test with BH correction for multiple testing was used to determine whether the mean Log2 FC TUDCA/Vehicle is statistically different from 0, *P < 0.05.
-
JSerum alanine aminotransferase (ALT) (left) and aspartate aminotransferase (AST) activities (right) from sepsisBIM mice pre‐treated for 4 consecutive days with vehicle or 500 mpk TUDCA (10 mice per group). The bar graphs show means ± SD (standard deviations). Student's t‐test was used to assess statistical significance, *P < 0.05.