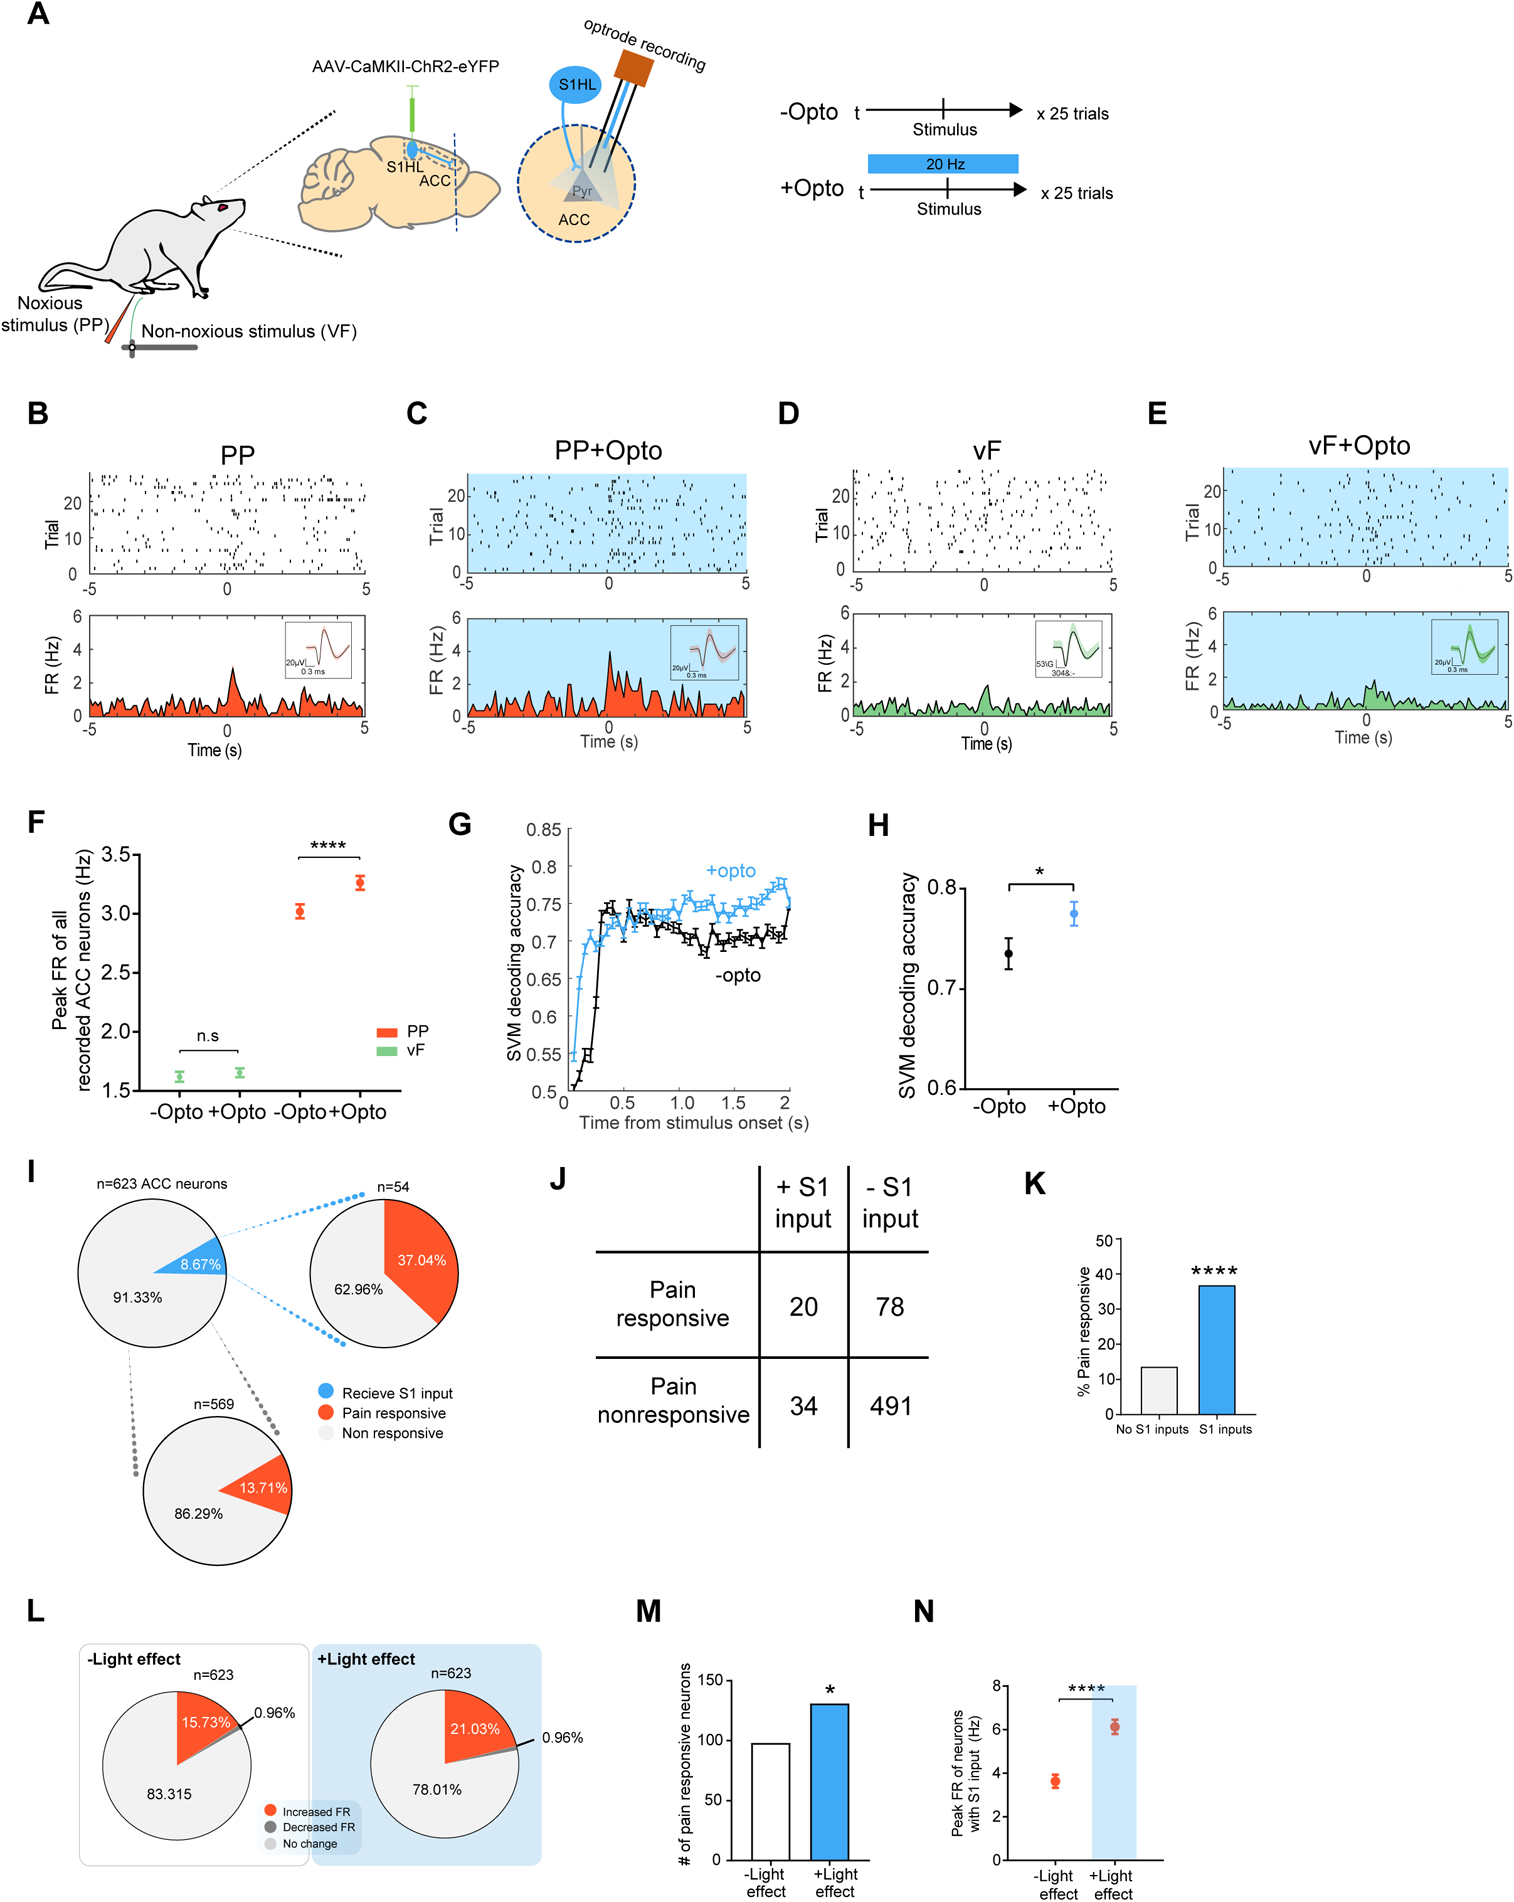
Figure 1. S1 inputs enhance the nociceptive response in the ACC.

(A) Schematic for in vivo optrode recording experiments. (B) Raster plots and peri-stimulus time histograms (PSTHs) of a representative ACC neuron without activation of S1 inputs. Time 0 indicates the onset of noxious pin prick (PP) stimulation. FR: firing rates. Inset shows representative single cell recordings. (C) Representative recording trace shows that optogenetic activation of the presynaptic S1 inputs increased the firing rates of a pyramidal neuron in the ACC, in response to PP. (D) Raster plots and PSTHs of a representative ACC neuron without activation of S1 inputs. Time 0 indicates the onset of non-noxious von Frey filament (vF) stimulation. (E) Representative recording trace shows that optogenetic activation of the S1 inputs did not change the firing rate response to vF in an ACC neuron. (F) Activation of the presynaptic S1 inputs increased the firing rates of ACC neurons, in response to PP. n = 623 from 5 rats; p < 0.0001, Wilcoxon matched-pairs signed rank test. In contrast, activation of the presynaptic S1 inputs had no impact on the firing rates of ACC neurons, in response to vF. n = 567 from 5 rats; p = 0.3299. (G) A representative session of SVM-based population-decoding analysis to distinguish between PP and vF in the presence of S1 activation, compared to a session without S1 activation. Time 0 denotes the onset of stimulus (PP or vF). The blue curve denotes the decoding accuracy in the presence of S1 activation, (n1 = 25 trials for PP, n2 = 25 trials for vF; C = 8 ACC neurons) derived from the data with true labels; the error bar denotes the SEM from 50 Monte Carlo simulations based on 2-fold cross-validation. (H) S1 activation increases the decoding accuracy to distinguish between noxious and non-noxious stimulation. n1 = 40, n2 = 48; p = 0.0406, Wilcoxon matched-pairs signed rank test. (I) Proportion of ACC neurons that received S1 inputs and their responsiveness to noxious stimulations. See Methods for criteria of responsiveness to S1 inputs. (J) A table illustrating the number of ACC neurons that respond to noxious inputs and number of neurons that respond to S1 activation. (K) ACC neurons that received S1 inputs (20 out of 54 total) were more likely to respond to noxious stimulations that neurons that did not receive S1 inputs (78 out of 569). p < 0.0001, Fisher’s exact test. (L) ACC response to noxious stimulations in the presence of S1 activation. (M) Activation of the S1 inputs increase the ACC response to PP. n = 98 vs 131 out of 623 neurons from 5 rats. p = 0.0191, Fisher’s exact test. (N) S1 inputs increased pain-evoked firing rates of ACC neurons. n = 54; p < 0.0001, Wilcoxon matched-pairs signed rank test. Data represented as mean ± SEM.
See also Figures S1 and S2.
