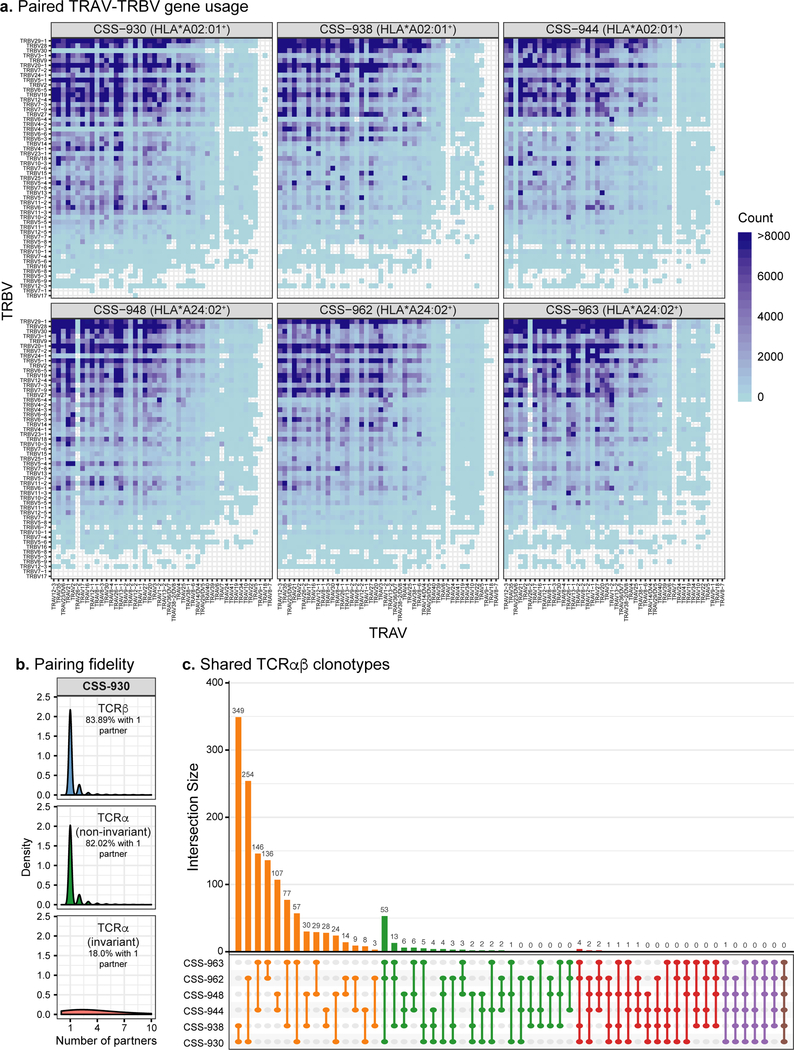
Fig. 2. Bioinformatic analysis of six paired TCRαβ repertoires.
a, Paired TRAV-TRBV gene usage across all six virus-seropositive TCRαβ repertoires. Blue shading indicates the number of unique clonotypes for each TRAV-TRBV combination for each repertoire. b, Number of partners for TCRβ, non-invariant TCRα, and known invariant TCRα sequences in the Donor CSS-930 repertoire. The density histogram indicates the relative abundance of TCR sequences comprising each category of number of partners. The percent of TCR clonotypes paired with only one partner is reported. c, UpSet plot showing counts of TCRαβ clonotypes that overlap between the six paired TCRαβ repertoires. For the Fig. 2b–c analyses, we required at least 2 sequencing reads per clonotype.

