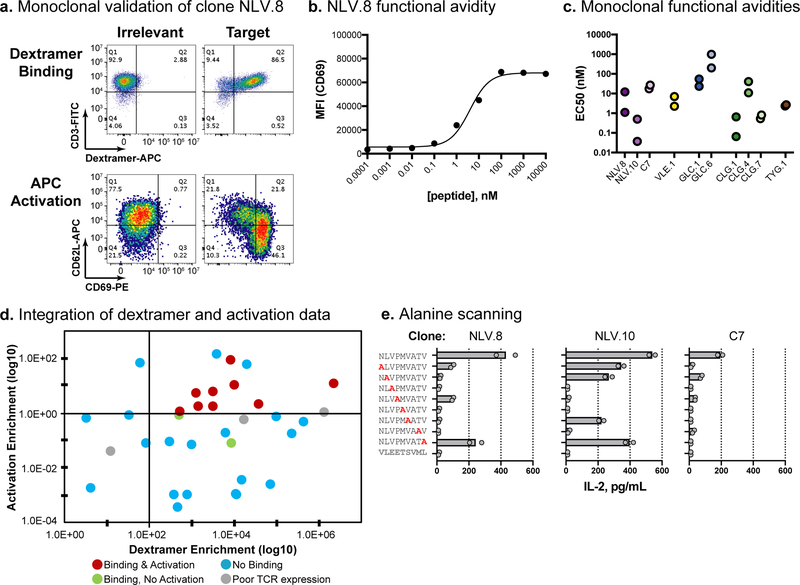
Fig. 4. Experimental validation of viral-specific TCRαβ clones.
a, Validation data for the NLV.8 monoclonal TCR. The top panels show dextramer binding; pMHC dextramer signal is on the x-axis and CD3 staining is on the y-axis. The bottom panels show Jurkat cell activation upon co-culture with peptide-loaded aAPCs; CD69 staining is on the x-axis and CD62L staining is on the y-axis. The left column is irrelevant and the right column is target peptide. Dextramer binding and cellular activation experiments were independently repeated twice with similar results. b, Functional avidity analysis of clone NLV.8 using T2 cells pulsed with a dilution series of peptide. Peptide loading concentration is on the x-axis and median fluorescence intensity (MFI) for CD69 staining is on the y-axis. Means are plotted from n=2 independent experiments. c, Functional avidity EC50 values calculated using peptide-pulsed T2 cells as described in b. Two independent experiments were conducted for each clone and the calculated EC50 values from each experiment are plotted. d, Integration of pMHC dextramer panning and activation data. Each point represents a unique clone, with clones colored according to their respective validation result. The dextramer enrichment of each clone is on the x-axis, and the activation enrichment (ratio of activated:input TCRβ read count frequency) is on the y-axis (based on data from Table 1). e, Functional specificity of viral-specific clones, using alanine scanning and IL-2 secretion. Clones NLV.8 and NLV.10 and the positive control (C7) are shown. T2 cells were loaded with wild type, single alanine mutation, or irrelevant peptides, and IL-2 secretion was measured by ELISA (x-axis). Replicate data (circles) and means (bars) are plotted for n=2 independent experiments.

