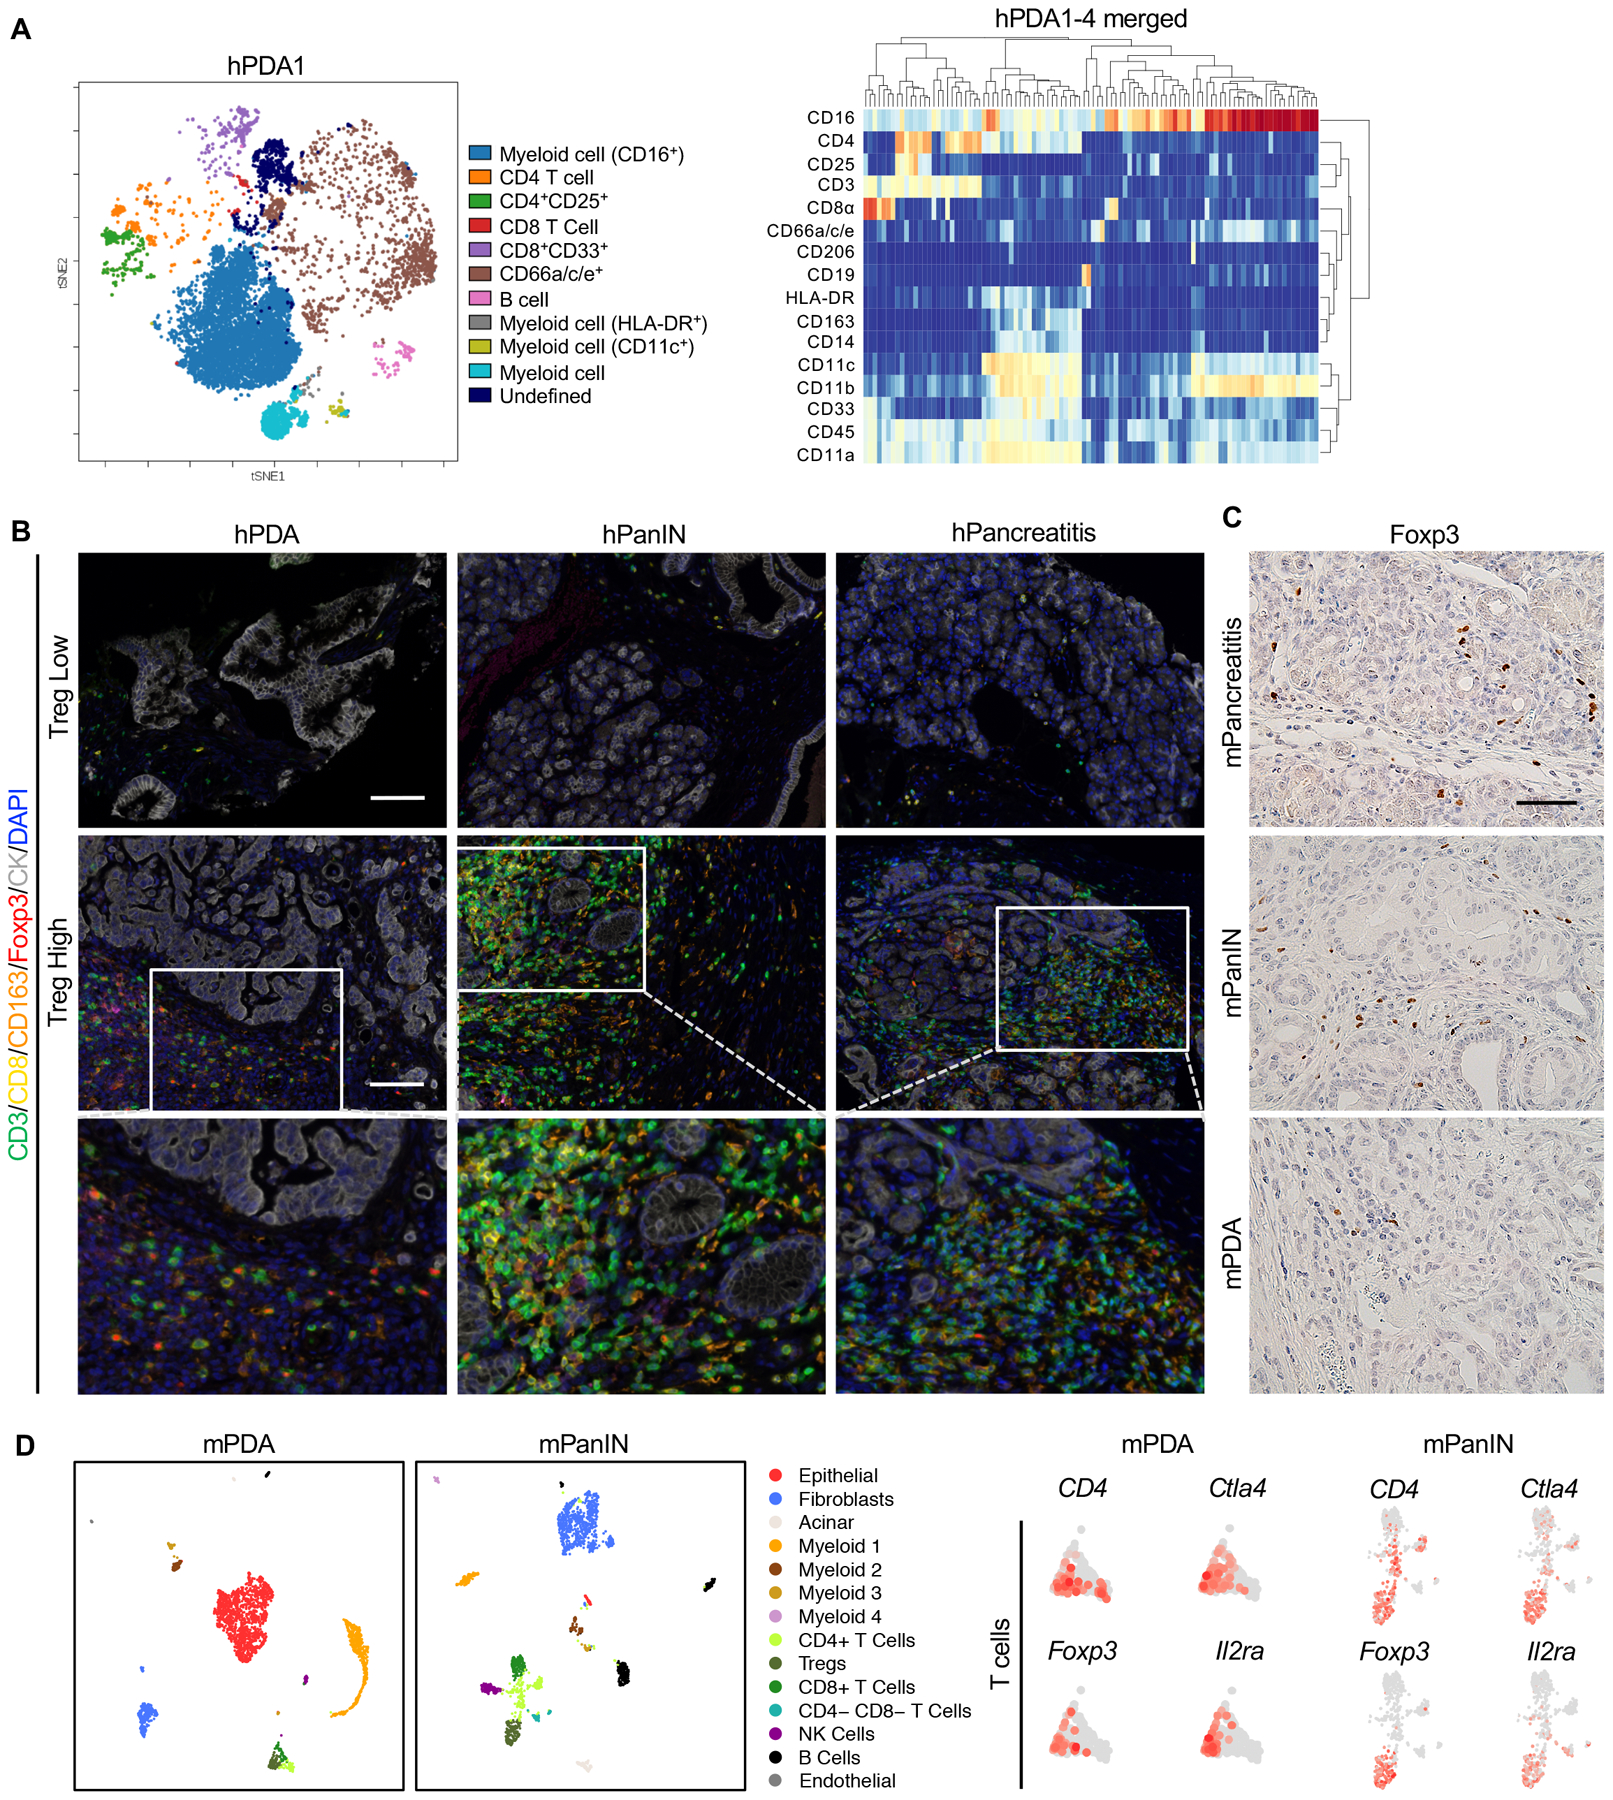
Figure 1. Regulatory T cells are prevalent in human PDA and PanINs.

(A) CyTOF immune profiling by FlowSOM-viSNE of human pancreatic tumors demonstrating the presence of CD4+CD25+ Tregs. (B) Representative images of Opal staining on human pancreatic lesion samples. Scale bar 100 μm. (C) Immunohistochemistry staining for Foxp3 staining in mouse pancreatic tissues. Scale bar 50 μm. (D) UMAP plots of single cell RNA sequencing analysis with mouse orthotopic pancreatic cancer samples or PanIN lesions, color-coded by their associated cluster (left) or color-coded for expression (gray to red) of Cd4, Ctla4, Foxp3 and Il2ra.
