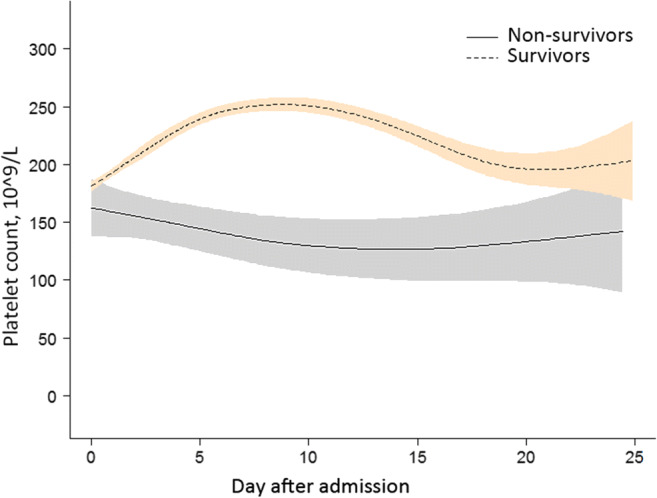
Fig. 3.

Association between changes in platelet count and mortality. A nonlinear association between changes in platelet count and mortality was found in a generalized additive model (GAM). Smooth curve fitting graph illustrated the platelet count in 532 COVID-19 patients (29 non-survivors and 503 survivors) based on the days after admission to hospital. The dotted line represented the survivors. The solid line represented the non-survivors. The blue and red-colored areas around the particular lines represented the 95% credible intervals. All adjusted for sex; age, years; white blood cell count, 10^9/L; neutrophil count, 10^9/L; lymphocyte count, 10^9/L; baseline platelet count, 10^9/L; history of hypertension; history of diabetes
