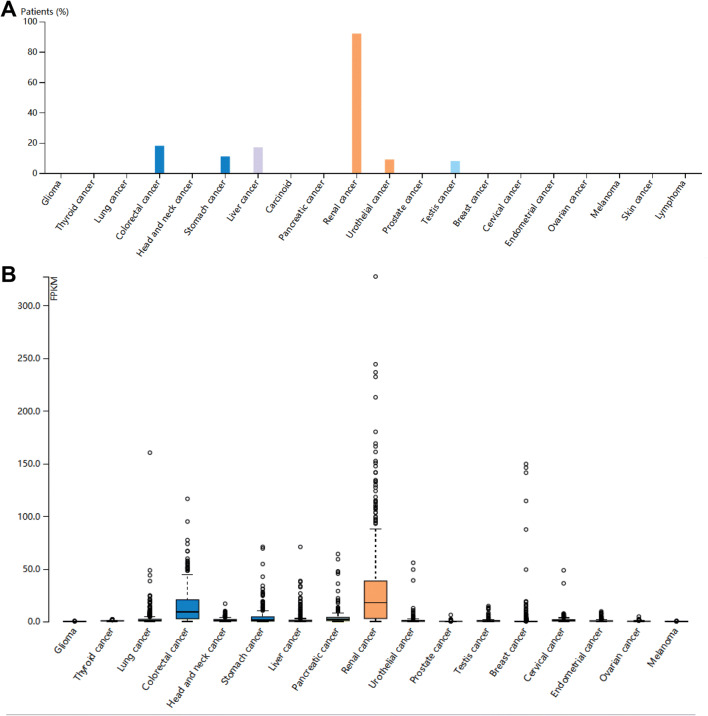
Fig. 4.
The protein and mRNA expression overviews for ACE2 in humans. a The ACE2 protein expression overviews. Tissue microarrays are used to show antibody staining for IHC in 20 different types of cancer with total samples of 216 cancer patients. Color-coded bars indicate the percentage of patients with high and medium protein expression levels in each cancer. The types of cancer are color-coded according to which type of normal organ cancer originates from. ACE2 protein expression with low or un-detectable will results in a white bar. b The ACE2 mRNA expression overviews. RNA expression overview shows RNA-seq data from The Cancer Genome Atlas (TCGA) from 17 cancer types representing 21 cancer subtypes with a corresponding major cancer type in the Human Pathology Atlas for comparisons. The FPKMs for each gene were subsequently used for quantification of expression with a detection threshold of the FPKM value of 1. Genes were categorized using the same classification as described above. RPKM stands for number fragments per kilobase of exon per million reads

