Figure 4.
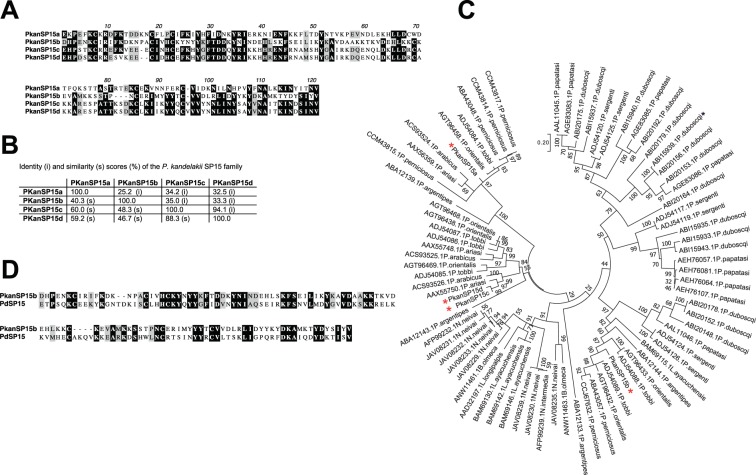
Sequence alignment and molecular phylogenetic analysis of the PkanSP15 proteins. (A,B) Protein sequence alignment and similarity and identity percentages of PkanSP15 using Muscle. Black shading and gray shading represent identical and similar amino acids, respectively. (C) The evolutionary history was inferred by using the Maximum Likelihood method based on the Whelan and Goldman model58. The tree with the highest log likelihood (−8196.26) is shown. The percentage of trees in which the associated taxa clustered together is shown above the branches. The tree is drawn to scale, with branch lengths measured in protein sequences number of substitutions per site. The analysis involved 78 amino acid sequences. All positions with less than 95% site coverage were eliminated. Evolutionary analyses were conducted in MEGA757. Red asterisks highlight PkanSP15 proteins and the black asterisk the PdSP15 protein. (D) Protein sequence alignment of PdSP15 and PkanSP15 using Muscle. Black shading and gray shading represent identical and similar amino acids, respectively.

