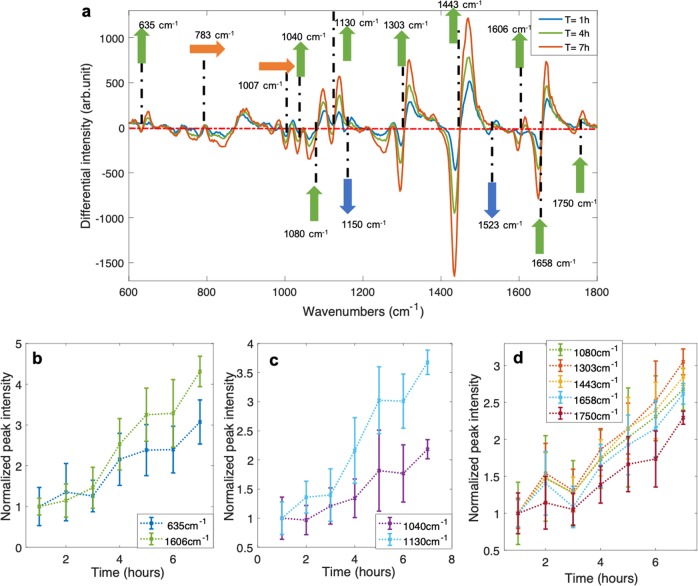
Fig. 2. INH-stress experiment.
a Shows the average WMR spectra for an INH-stress experiment, presenting the first (T = 1 h; blue spectrum), an intermediate (T = 4 h; green spectrum) and the last (T = 7 h; red spectrum) time point of the experiment. The green, orange and blue arrows are, respectively, showing the Raman peaks that are increasing, stable and decreasing over time based on the three INH-stress experiments. The x-axis presents the wavenumbers in cm−1, while the y-axis shows the intensity in arbitrary unit. In WMR spectra, the zero crossings on the red dash-dotted line shows the positions of the Raman peaks. b–d Present the evolution of Raman peak intensities over time. b Shows the Raman peaks at 635 cm−1 and 1606 cm−1 (associated with tyrosine) intensities during the experiment. c Presents the Raman peaks at 1040 cm−1 and 1130 cm−1 (associated with carbohydrates) intensities over time. d Shows the Raman peaks at 1080, 1303, 1443, 1658 and 1750 cm−1 (associated with lipids) intensities over the course of experiment. The x-axis shows time in hours, and y-axis the normalised intensity of the Raman peaks.

