Fig. 1.
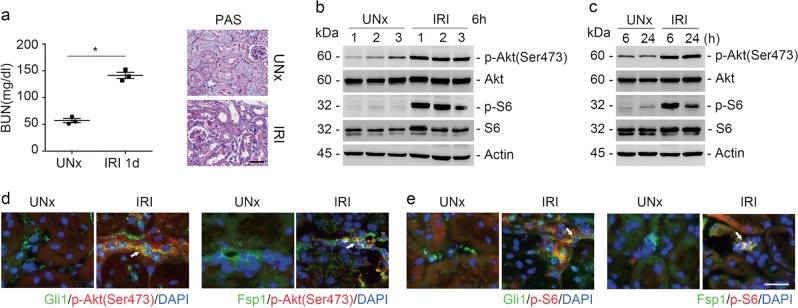
Both mTORC1 and mTORC2 signaling are activated in kidney fibroblasts after IRI. a The graph showing the blood urea nitrogen (BUN) level in CD-1 mice at day 1 after UNx or IRI. *P < 0.05, n = 3 (left). Kidney histology as shown by periodic acid-Schiff (PAS) staining. Scale bar = 20 µm (right). b, c Western blot analyses showing the induction of p-Akt (Ser473), and p-S6 in the kidneys after ischemia-reperfusion injury (IRI). The numbers indicate each individual animal within the given group (b). The samples were pooled from three animals within each group (c). d Representative images showing the induction for p-Akt (Ser473) and p-S6 in Gli1- or Fsp1-positive fibroblasts from the IRI kidneys. White arrows indicate the co-staining positive cells. Scale bar = 20 µm

