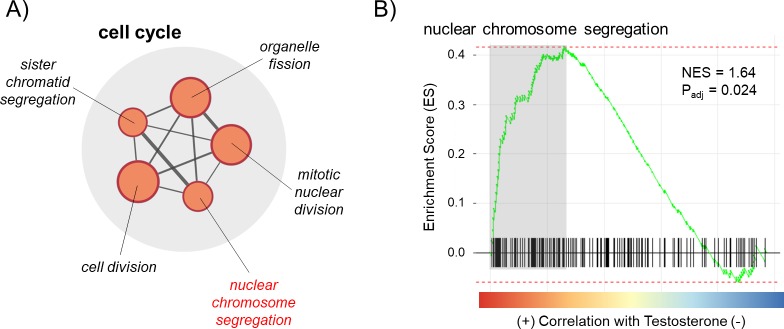
Fig 3.
(A) Enrichment Map showing a functional group of gene sets related to cell cycle that were detected in a Gene Set Enrichment Analysis (GSEA) comparing testosterone- versus control-treated hens, one of which was nuclear chromosome segregation (highlighted in red). Only gene sets with padj < 0.05 are included. Node size corresponds to gene set size. Normally, color would designate the direction the gene sets were altered (red = enriched in testosterone-treatment, blue = depleted in testosterone-treatment), but in this case, all were enriched in samples from testosterone-treated hens, so all are red. Line thickness connecting the gene set nodes represents the degree of gene overlap between the two sets. (B) GSEA enrichment plot for a select gene set. Black bars represent the position of members of the gene set in the ranked list together with the running enrichment score (ES; plotted in green). The adjusted p-value and normalized enrichment score (NES) are presented. Leading edge genes (i.e., those that contribute most to the ES) are highlighted in gray and can be found in S2 Table.

