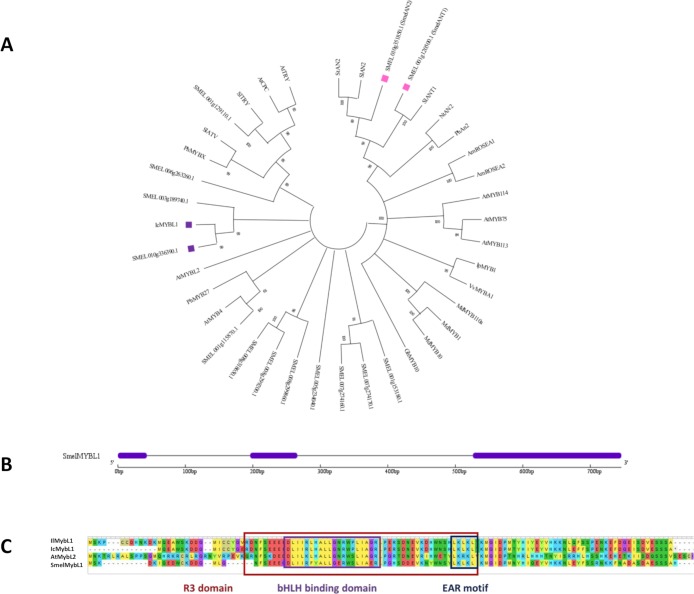
Fig 3.
(A) Phylogenetic tree of MYB transcription factors related to flavonoid synthesis. The optimal NJ tree with the sum of branch length = 8,61587540 is shown. The tree is drawn to scale, with branch lengths in the same units as those of the evolutionary distances used to infer the phylogenetic tree. The percentage of replicate trees in which the associated taxa clustered together in the bootstrap test (1,000 replicates) are shown next to the branches. Branches corresponding to partitions reproduced in less than 50% bootstrap replicates are collapsed. The evolutionary distances were computed using the p-distance method and are in the units of the number of amino acid differences per site. The analysis included 39 amino acid sequences. Positive and negative candidate MYBs analysed in this work are marked with pink and purple square, respectively. (B) Exon/intron structure of S. melongena MYBL1 gene. The exons and introns are represented by purple boxes and black lines, respectively. (C) Domain structure of MYBL1 type repressors.

