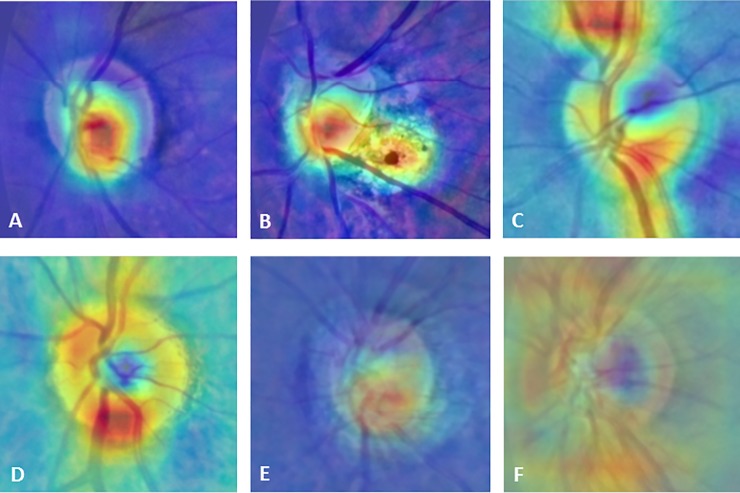
Fig 7. Representative CAMs and superimposed images showing different patterns between the glaucomatous and healthy eyes.
The hot spots (red color) were localized at the cup and the region of parapapillary atrophy in the glaucomatous eyes (A, B), and at the neuroretinal rim or along the nerve fibers bundles in the healthy eyes (C, D). The superimposed images with CAM centered at the disc, showed the different patterns of CAM between the glaucomatous (E) and healthy eyes (F). CAM, class activation maps.

