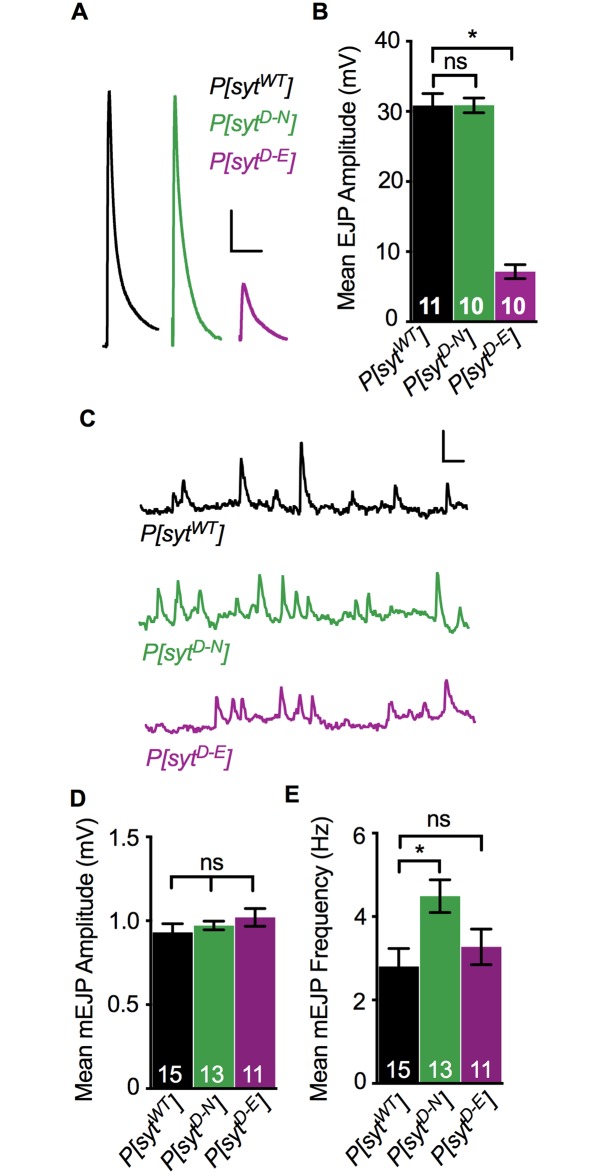
Fig 2. Ca2+ binding mutants had differential effects on evoked and spontaneous release.
A. Representative EJP traces from P[sytWT], P[sytD-N], and P[sytD-E]. Scale bars = 5 mV, 0.1 s. B. Mean EJP amplitude in P[sytD-N] was unimpaired, but in P[sytD-E], it was significantly decreased compared to control (*p < 0.0001). C. Representative mEJP traces from P[sytWT], P[sytD-N], and P[sytD-E] showing 3 consecutive seconds of spontaneous mEJPs. Scale bars = 1 mV, 0.2 s. D. Mean mEJP amplitude was similar among genotypes. E. Mean mEJP frequency was increased in P[sytD-N] (*p = 0.01) but unchanged in P[sytD-E] relative to P[sytWT]. Recorded in HL3.1 containing 1.0 mM Ca2+, all error bars depict SEM, and n’s within bars represent number of muscle fibers tested. ns = not significant.

