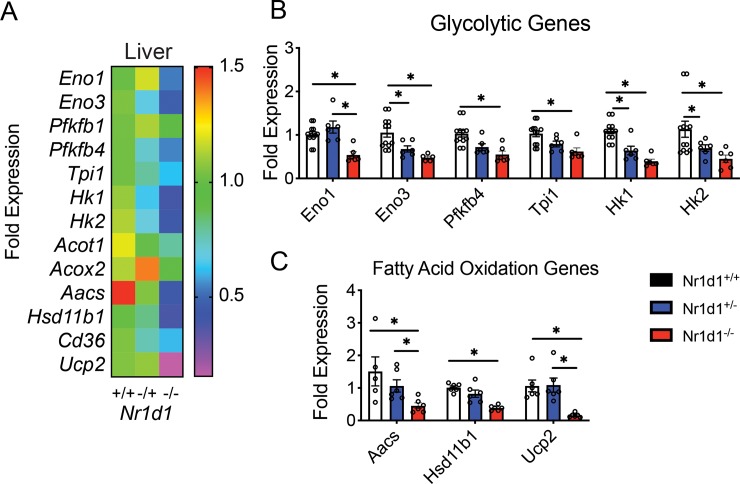
Fig 6. Heterozygous Nr1d1 mice display a reduction in glycolytic gene expression and preserved fatty acid metabolism in the liver.
(a) Heat-map showing RT-qPCR-quantified expression pattern of glycolytic (Eno1, Eno3, Pfkfbp1, Pfkfbp4, Tpi1, and fatty-acid oxidation enzymes (Hk1, Hk2, Acot1, Acox2, Aacs, Hsb11b1, Cd35, Ucp1) in the livers Nr1d1 +/-, Nr1d1+/- and Nr1d1-/- mice (b) Mean glycolytic gene expression in the livers of 15-week-old Nr1d1 +/-, Nr1d1+/- and Nr1d1-/- mice (n = 5). (c) *p<0.05 determined by One-Way ANOVA. Data represented as a mean ± s.e.m.

