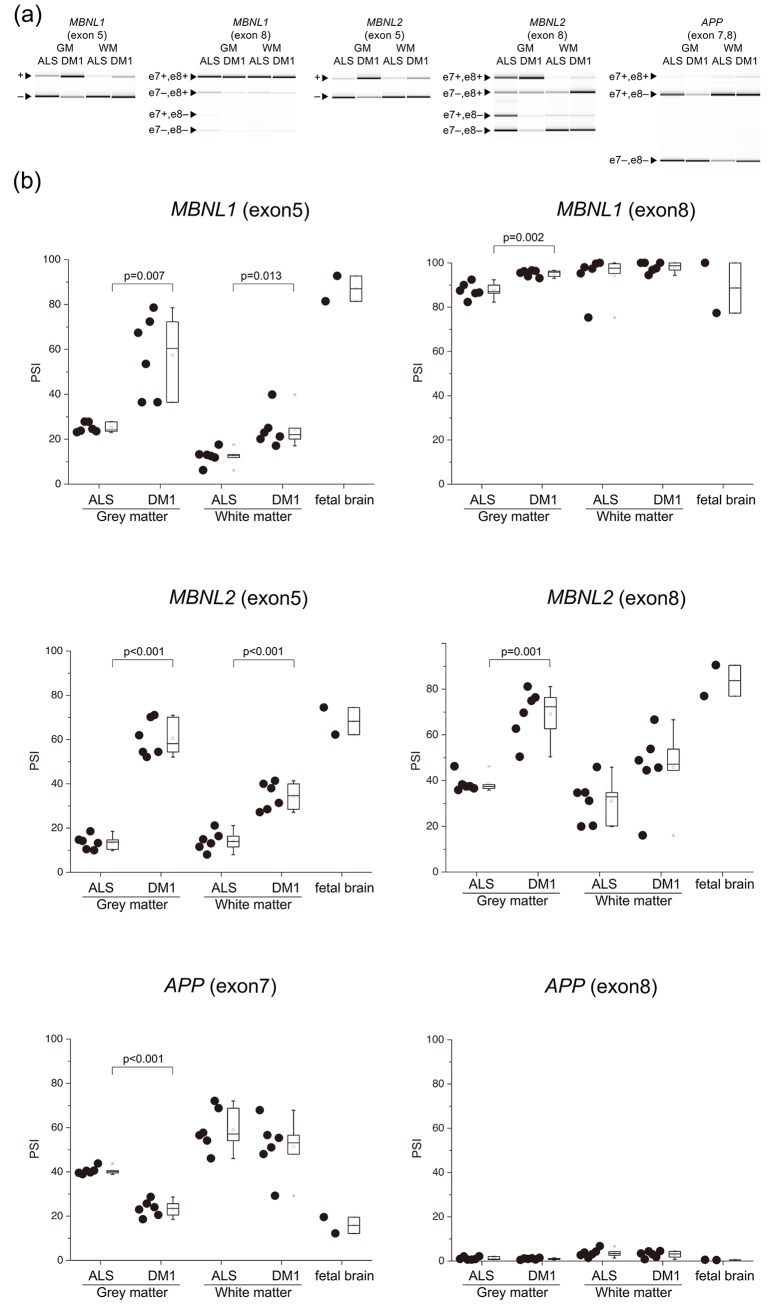
Fig 3. Aberrant splicing between the GM and WM.
(a) Representative RT-PCR products from the frontal lobe GM and WM in ALS and DM1. (b) Inclusion ratios of splicing changes in the GM and WM. PSI values of all examined genes were compared by Welch’s T-test. In the box-and-whisker plot, the line inside the box represents the median and the square symbol represents the average. ALS, amyotrophic lateral sclerosis; DM1, myotonic dystrophy type 1; GM, grey matter; WM, white matter.

