
Fig 2. Example of model calibration.
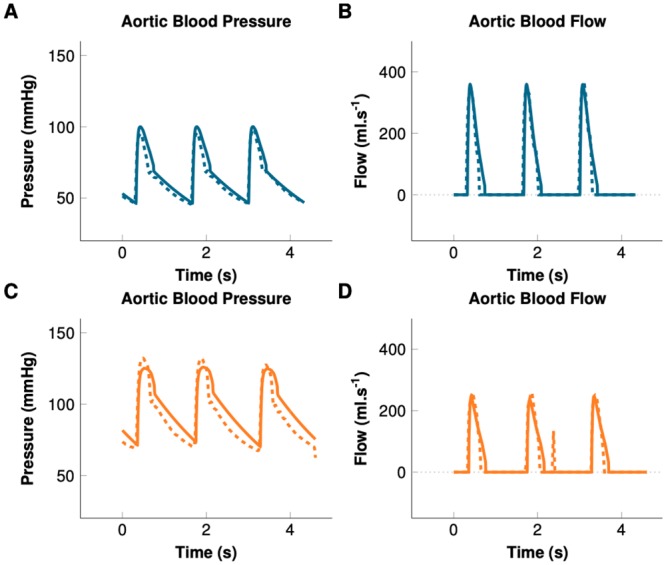
Solid lines represent the result of the patient-specific simulation. Dashed lines represent measured data. Blue: Hypotensive. Orange: Maximum effect of norepinephrine.
Official websites use .gov
A
.gov website belongs to an official
government organization in the United States.
Secure .gov websites use HTTPS
A lock (
) or https:// means you've safely
connected to the .gov website. Share sensitive
information only on official, secure websites.
Solid lines represent the result of the patient-specific simulation. Dashed lines represent measured data. Blue: Hypotensive. Orange: Maximum effect of norepinephrine.