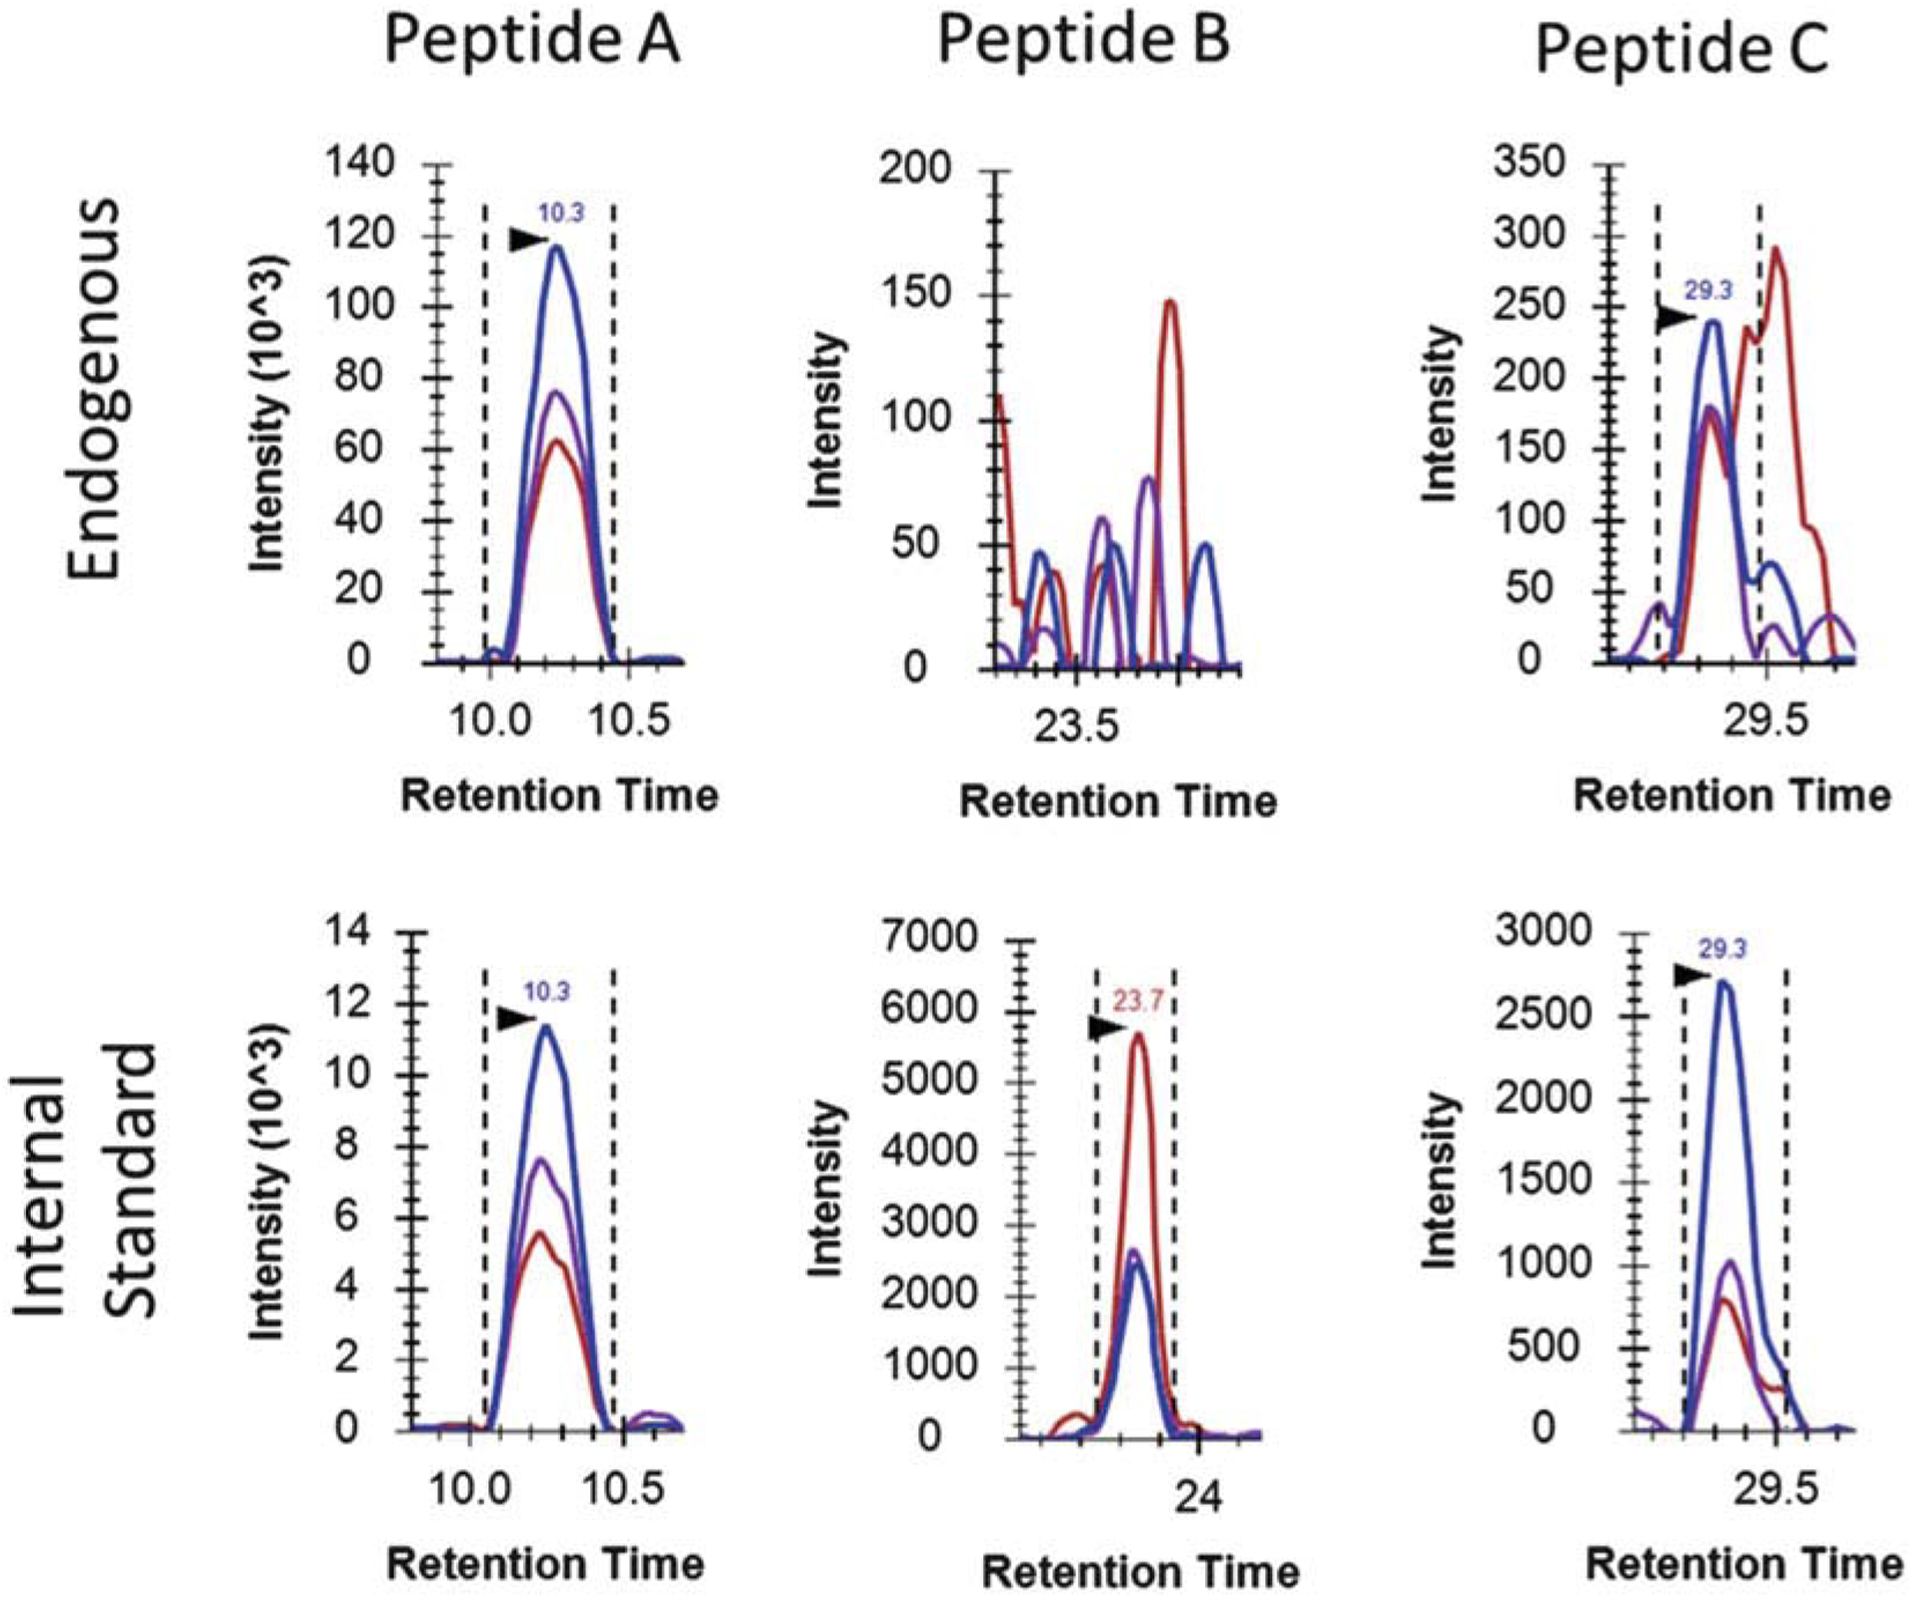
Fig. 2.

Extracted ion chromatograms (XICs) of three peptides (A, B, C) in a urine sample. The dotted lines demonstrate the peak boundaries, while the arrows indicate the retention times. Peptide A shows confident detection and quantification, while peptide B lacks of clear signals, and peptide C suffers from matrix interferences
