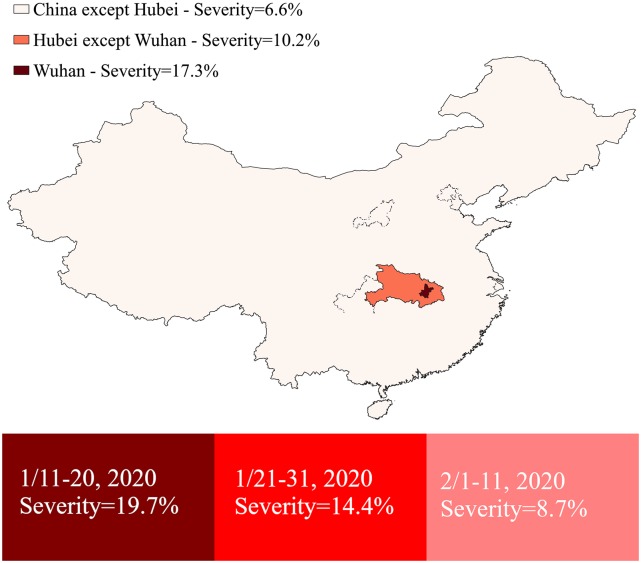
Fig 2. Percentage of COVID-19 infected healthcare workers in severe conditions in different geographic locations and over three ten-day periods, based on symptom onset dates.
This map was created by authors with QGIS 3.12, using shapefiles available from The Humanitarian Data Exchange (https://data.humdata.org/).

