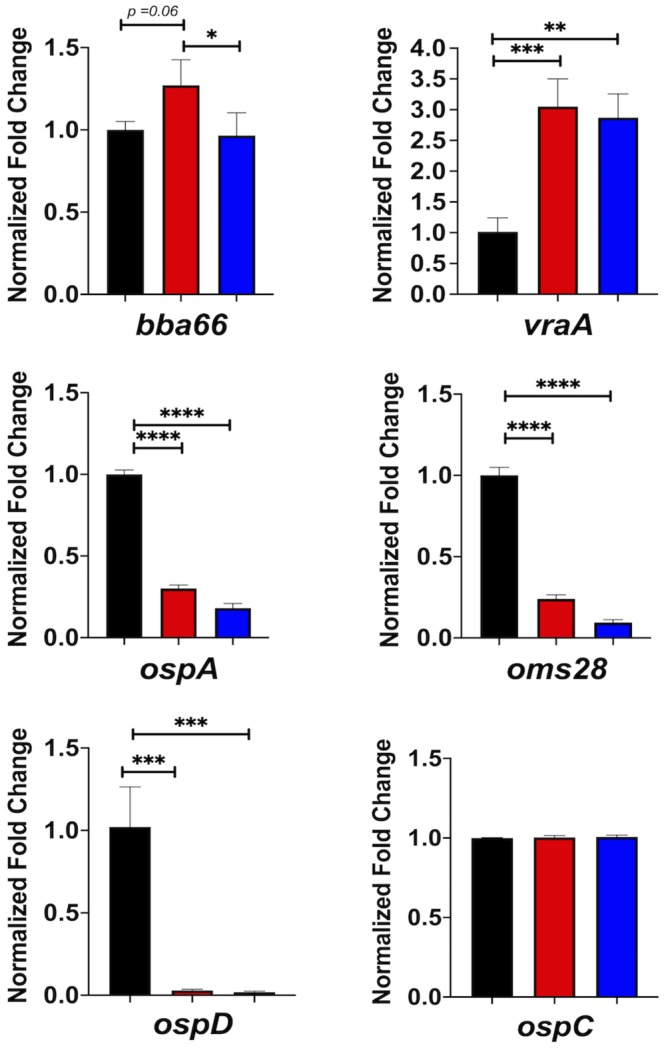
Fig 7. Quantification of transcripts by qRT-PCR.

Quantitative RT-PCR (qRT-PCR) of the parent (black bars), ittA mutant (red bars), and complemented strain (blue bars) were performed for a subset of transcripts indicated at the bottom of each panel. The data for all samples were normalized to the endogenous control, flaB, whose transcription was not affected by the conditions used in the experiment. The error bars indicate standard error. Significance is denotated as * p < 0.05, ** p < 0.01, *** p < 0.001. **** p < 0.0001.
