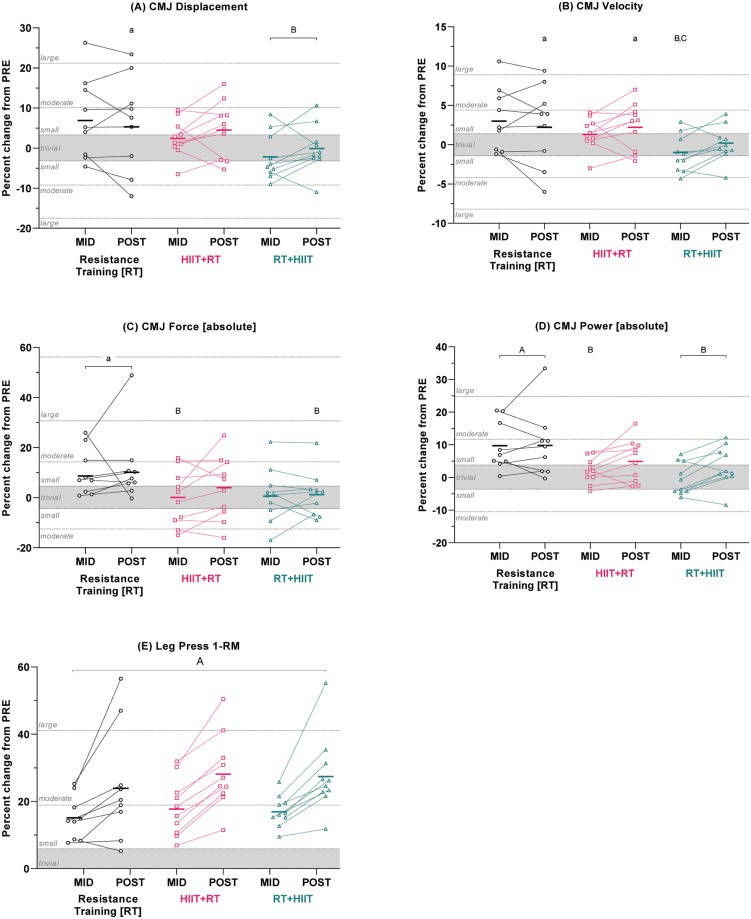
Fig 3. Percent changes in strength and power indices after 5 (MID) and 9 (POST) weeks of training.
(A) Peak CMJ displacement, (B) velocity, (C) force, (D) power, and (E) leg press 1-RM strength. Data are adjusted group means (solid dash), plus unadjusted individual percent changes. The trivial region was determined from the smallest worthwhile change for each variable (0.2 × combined between-subject baseline SD). a/A = within-group difference vs PRE; b/B = between-group difference vs RT at same time point; c/C = between-group difference vs HIIT+RT at same time point. Capital letters denote effects that remained clear after adjustment for multiple comparisons.

