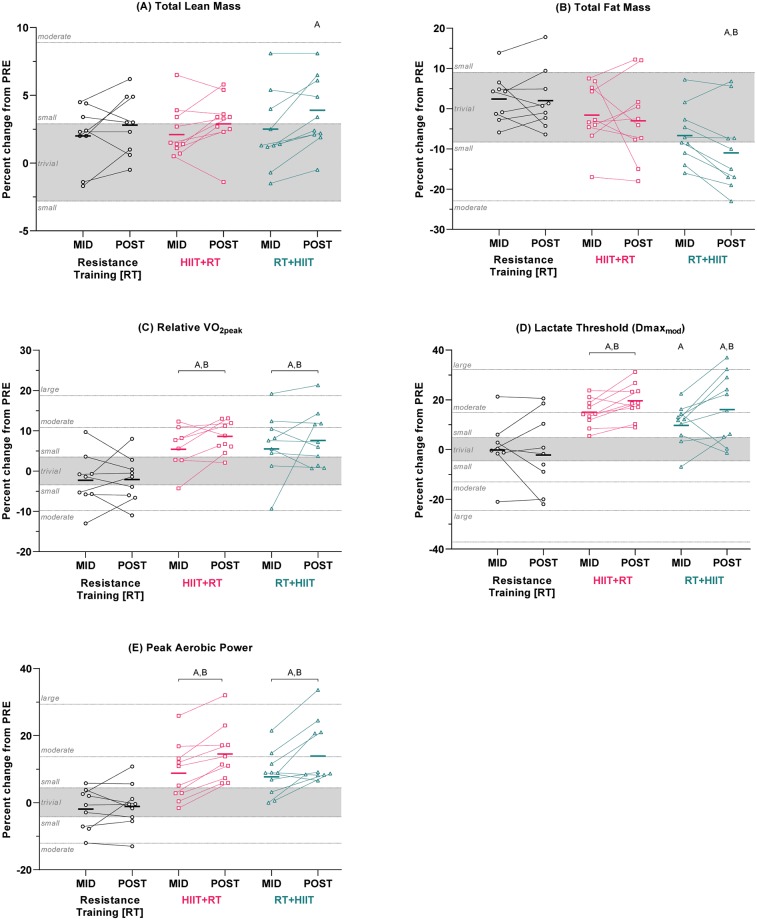
Fig 4. Percent changes in body composition and aerobic fitness after 5 (MID) and 9 (POST) weeks of training.
(A) Total lean mass, (B) total fat mass, (C) relative , (D) lactate threshold, and (E) peak aerobic power. Data are adjusted group means (solid dash) with unadjusted individual percent changes. The trivial region was determined from the smallest worthwhile change for each variable (0.2 × combined between-subject baseline SD). a/A = within-group difference vs PRE; b/B = between-group difference vs RT at same time point; c/C = between-group difference vs HIIT+RT at same time point. Capital letters denote effects that remained clear after adjustment for multiple comparisons. N.B. due to an equipment fault at the time of testing, PRE-to-MID changes are unavailable for 2 participants in HIIT+RT (), and one from RT ().

