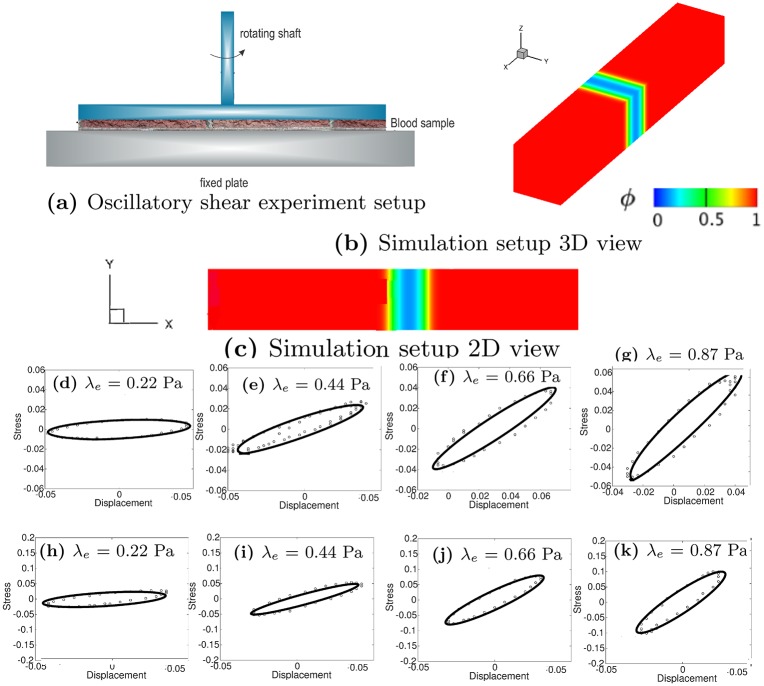
Fig 8. Calibration of thrombus elastic shear modulus λe.
(a) Experimental setup for a typical oscillatory shear test. (b) 3D view of the simulation setup. (c) 2D view of the simulation setup. Third and Fourth rows: Stress-displacement loop for different λe. Quantities are all in non-dimensional units. Third row (d-g): VF (volume fraction) = 0.3419; Fourth row (h-k): VF = 0.5129. Points are data and lines are the fits. Displacement and stress are nondimensionalized with the characteristic velocity and length scales 3.33 × 10⁻³ m/s and 3 × 10⁻⁴ m, respectively.

