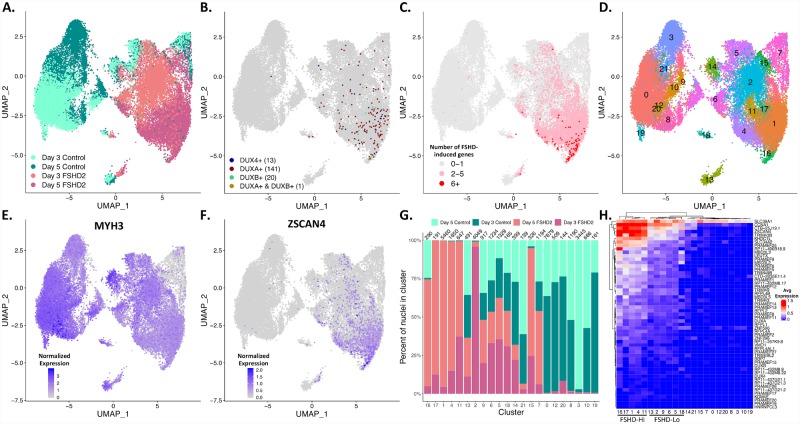
Fig 3. Day 3 and day 5 FSHD2 myotube nuclei cluster based on expression of FSHD-induced genes.
(A) Day 3 and day 5 myotube nuclei from control-2 and FSHD2-2 plotted on a UMAP based off of expression values from 3’ end sequencing from libraries prepared using the BioRad’s ddSeq. Control and FSHD2 nuclei separate across component 1 (UMAP_1). Day 3 and day 5 nuclei separate within cell type with some mixing. (B) UMAP from (A) colored by detection of DUX4, DUXA and/or DUXB. The number of nuclei in which we detect (counts >0) the indicated gene is in parentheses. (C) UMAP from (A) colored by the number of FSHD-induced genes detected (counts >0). (D) UMAP from (A) colored by cluster determined by shared nearest neighbors (SNN). Each cluster is colored and labeled by its respective number. (E) UMAP from (A) colored by expression of the myogenic marker MYH3. (F) UMAP from (A) colored by expression of the FSHD-induced gene ZSCAN4. (G) The percent of control and FSHD2 nuclei from day 3 or day 5 in each cluster from (D). The total number of nuclei in each cluster is indicated above each bar. Colored by cell line and day of differentiation. (H) Average expression profiles of the FSHD-induced genes in each cluster. Rows and clusters are ordered and dendrogram is calculated using Euclidean distance.

