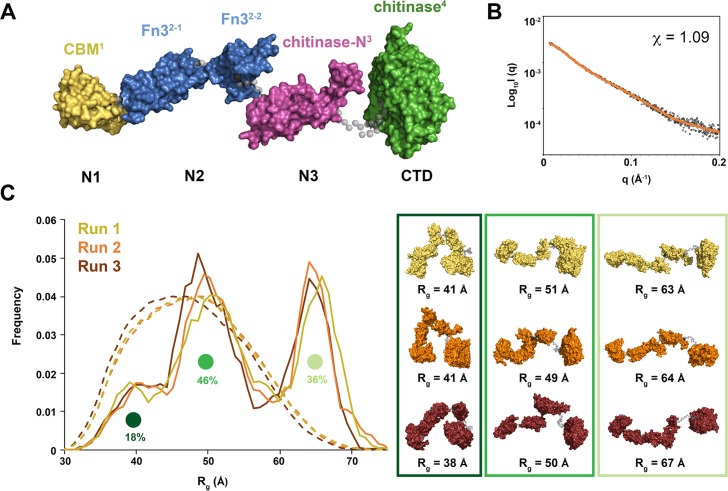
Fig 3. Model of ChiA-FL in solution.
(A) Initial model of ChiA generated by EOM 2.0 [30]. Linkers are shown as grey spheres. (B) EOM fit (orange line) to the ChiA SAXS data (black open circles) with χ2 of 1.09. (C) Three independent ensemble optimization method runs (yellow, orange and burgundy) yielded similar distributions of three populations. Sample ChiA models corresponding to the centre of each population for all three runs are shown.

