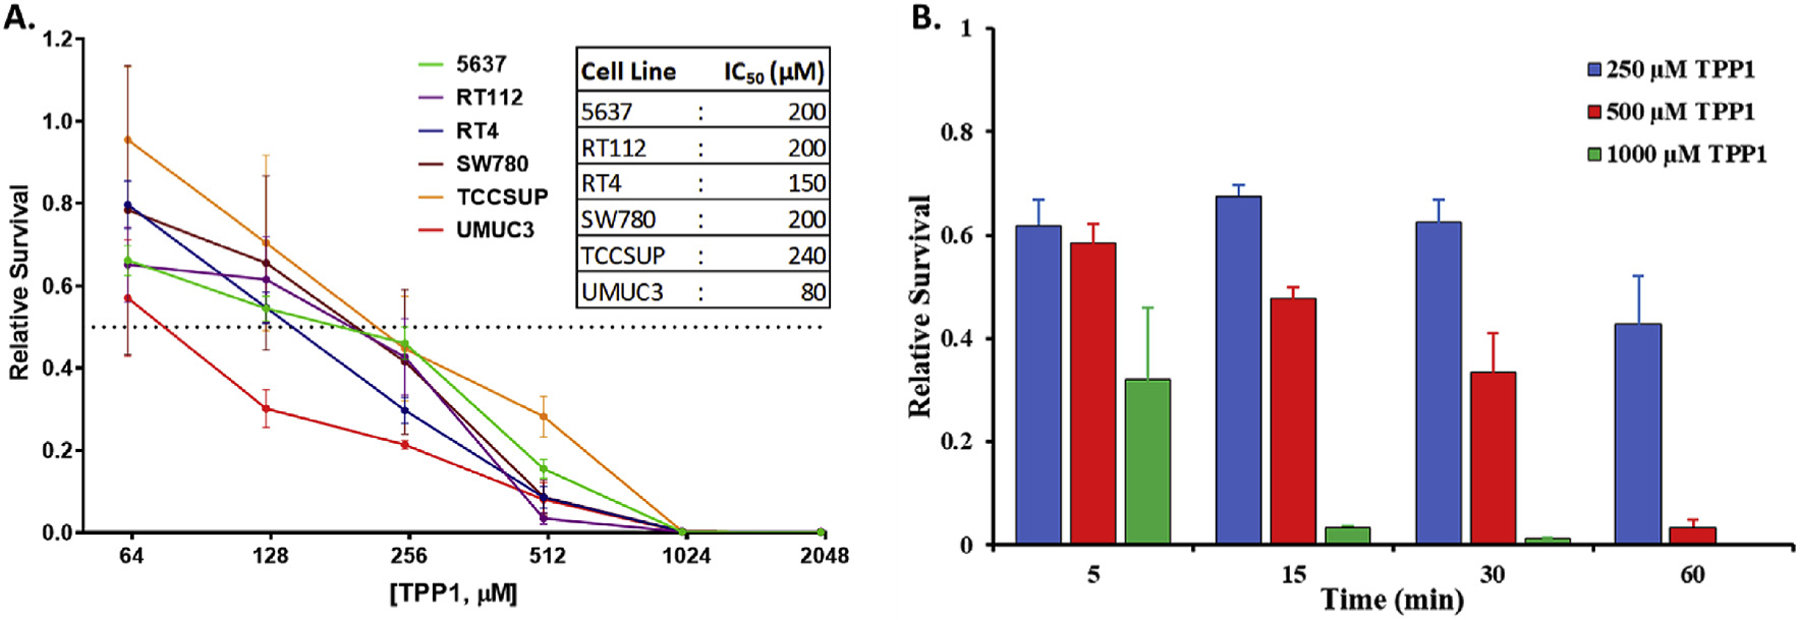
Fig. 2.

(A) Growth inhibition caused by TPP1 to various bladder cancer cell lines at 1 h exposure time, measured as the relative survival with respect to untreated cells. The dotted line parallel to x-axis represents 50% survival cutoff. Table inset shows the calculated GI50 values of TPP1 for each cell line. (B) Growth inhibition of RT112 cells caused by different concentrations of TPP1 at different exposure times.
