
FIGURE 2.
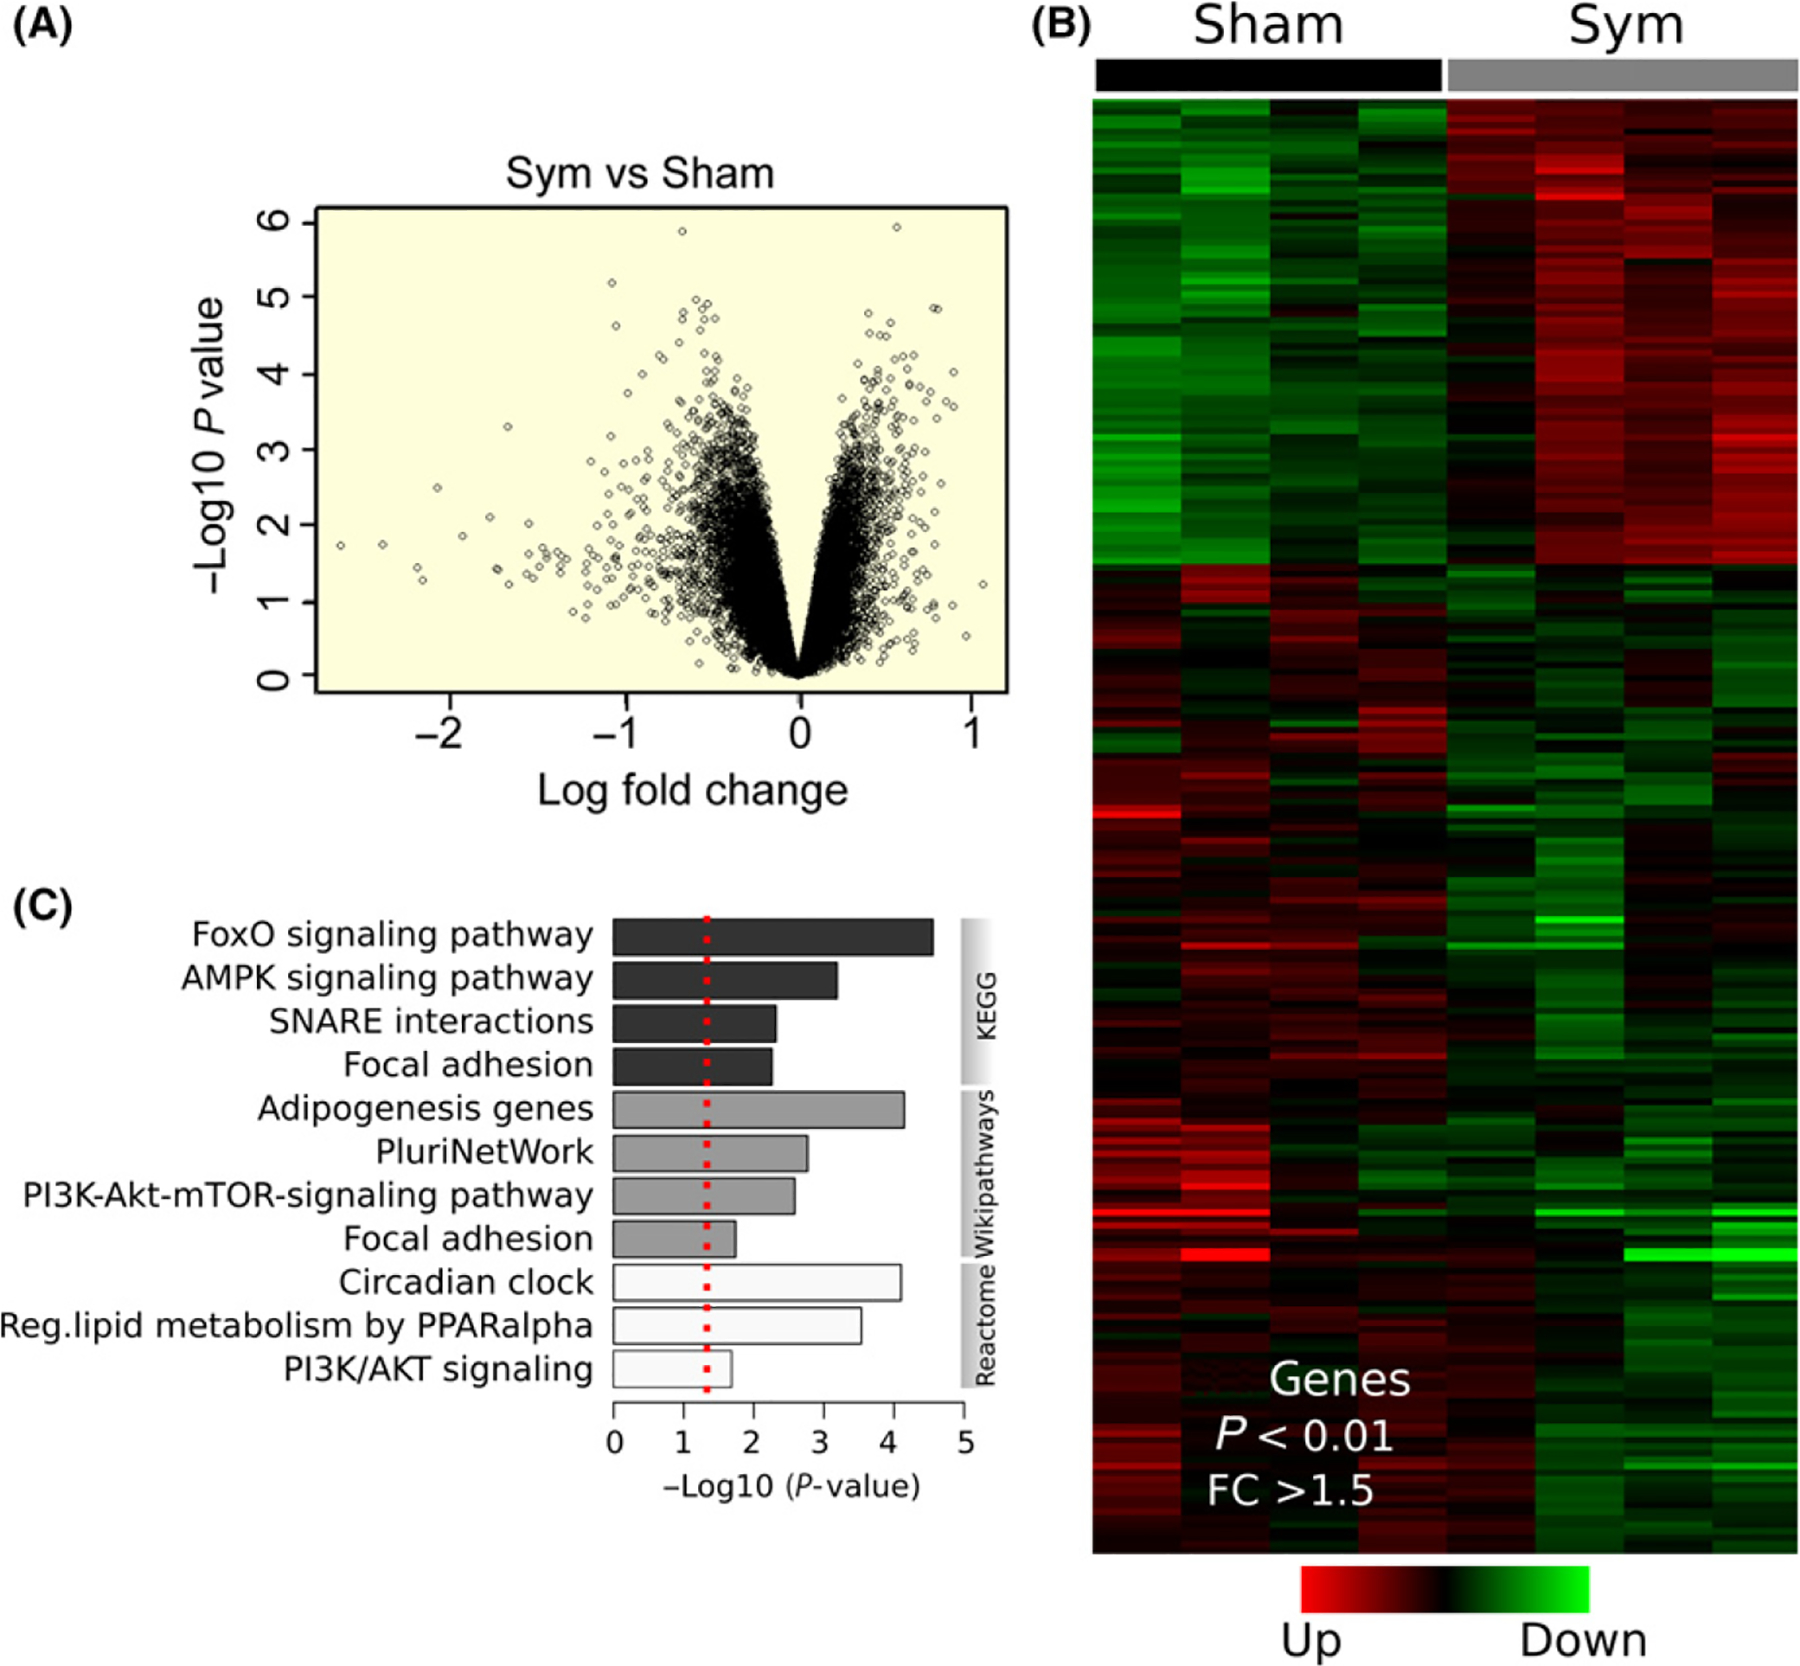
Extensive regulation of gene transcription by skeletal muscle sympathetic innervation. A, Volcano plot representing the significance (−Log10 P value) and magnitude of transcript change (Log fold change) in the GA muscle from sympathetic denervated and sham mice. B, Heat map of 182 differentially expressed genes in the GA muscle from sympathetic denervated and sham mice (four GA muscles from four mice per group). C, Functional enrichment analysis of differentially expressed transcripts determined by KEGG, Wikipathways, and Reactome databases. The red dotted line represents cut-off significance level of P < 0.01